
Figure 1.
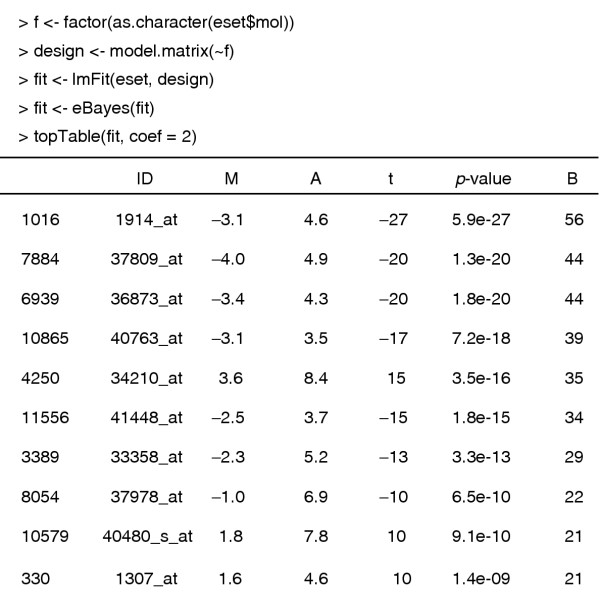
Limma analysis of the ALL data. The leftmost numbers are row indices, ID is the Affymetrix HGU95av2 accession number, M is the log ratio of expression, A is the log average expression, and B is the log odds of differential expression.
Official websites use .gov
A
.gov website belongs to an official
government organization in the United States.
Secure .gov websites use HTTPS
A lock (
) or https:// means you've safely
connected to the .gov website. Share sensitive
information only on official, secure websites.
Limma analysis of the ALL data. The leftmost numbers are row indices, ID is the Affymetrix HGU95av2 accession number, M is the log ratio of expression, A is the log average expression, and B is the log odds of differential expression.