
Fig 2. Forrest plot of comparisons inter-patient. IV = inverse variance method; CI = confidence interval; M-H = mantel-Haenszel.
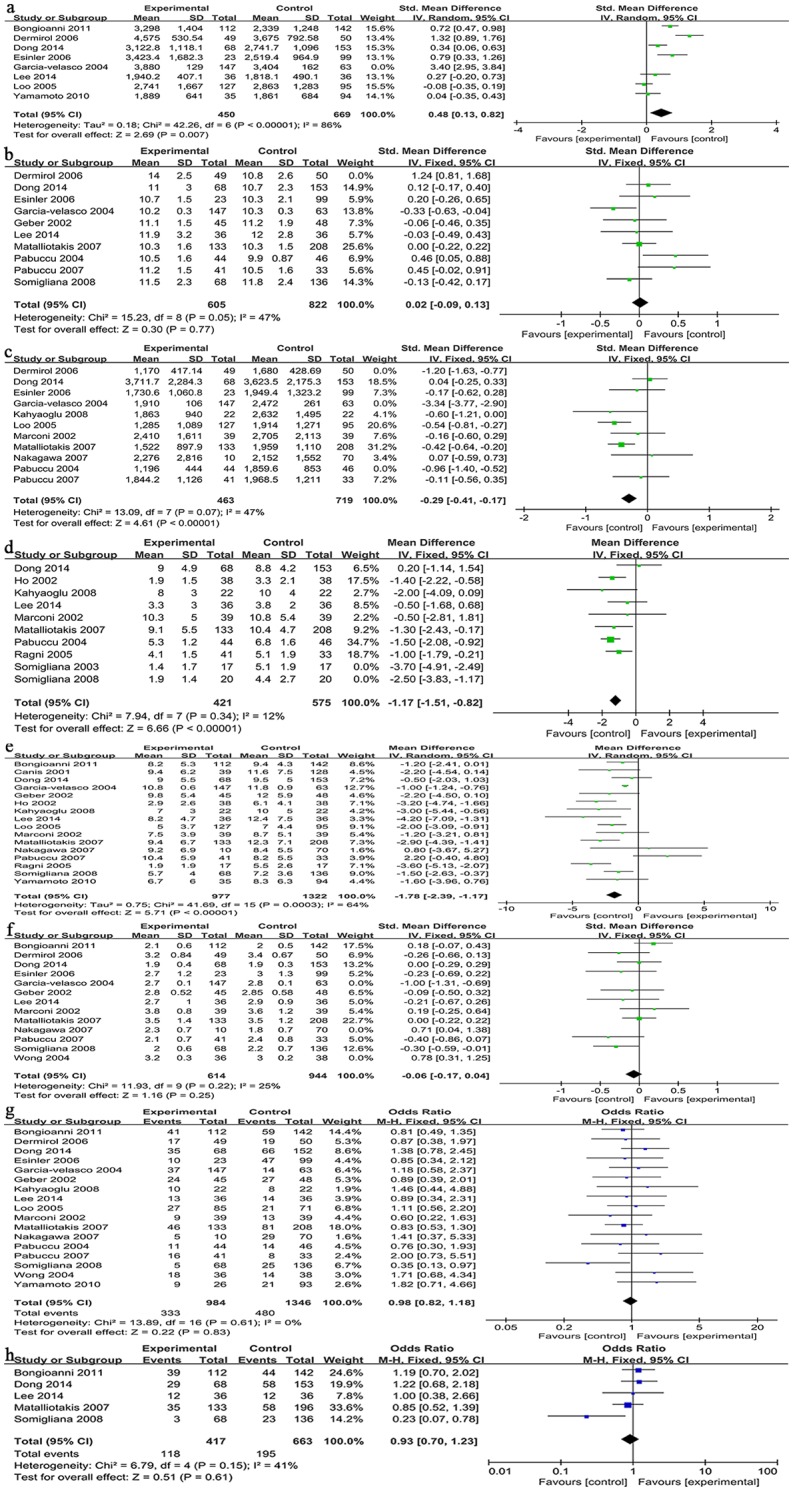
(a) Total amount of gonadotropin (Gn) used. (b) Duration of stimulation. (c) Estrogen (E) level on HCG day. (d) Number of mature or dominant follicle. (e) Total number of oocytes retrieved. (f) Total formed embryos. (g) Pregnancy rate. (h) Live birth rate.