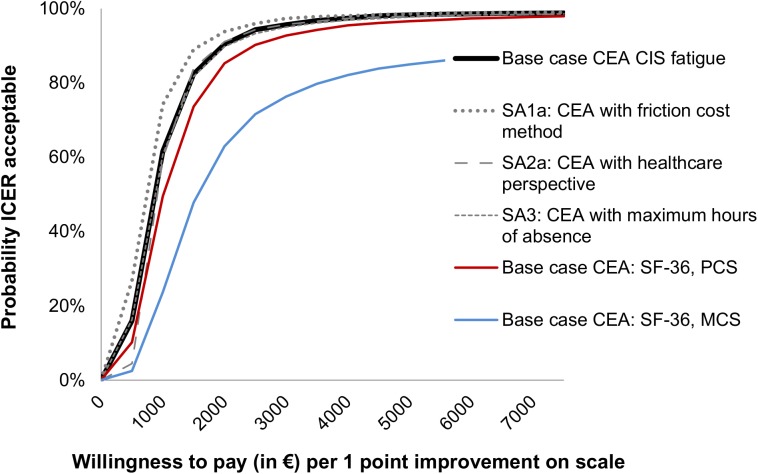
Fig 2. Acceptability curves of the cost-effectiveness (outcome CIS fatigue and SF-36) at 52 weeks follow-up.
SA = Sensitivity analysis, CEA = Cost-effectiveness analysis, CIS = Checklist Individual Strength, SF-36 = Short-form 36, PCS = Physical component summary score, MCS = Mental component summary score.

