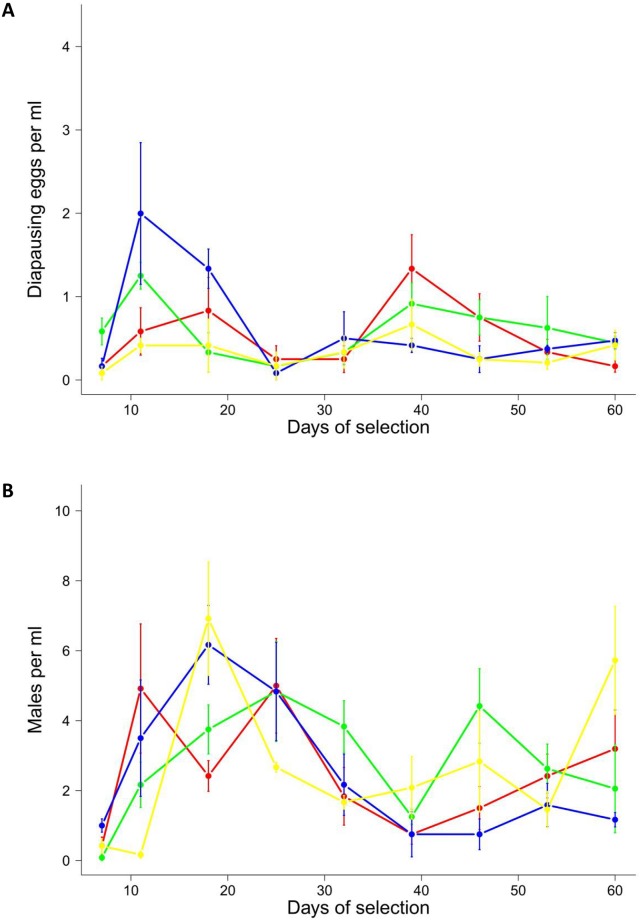
Fig 3. The change of sexual reproduction for Brachionus calyciflorus rotifers in the F-S-Environment.
(A) Density of diapausing eggs ml-1 (dots represent mean values, bars ±1 standard error) and (B) males ml-1, both plotted over time. Yellow: A-Populations, Blue: F-Populations, Green: S-Populations and Red: F-S-Populations. Counts are based on three independent samples from each replicate (n = 4).

