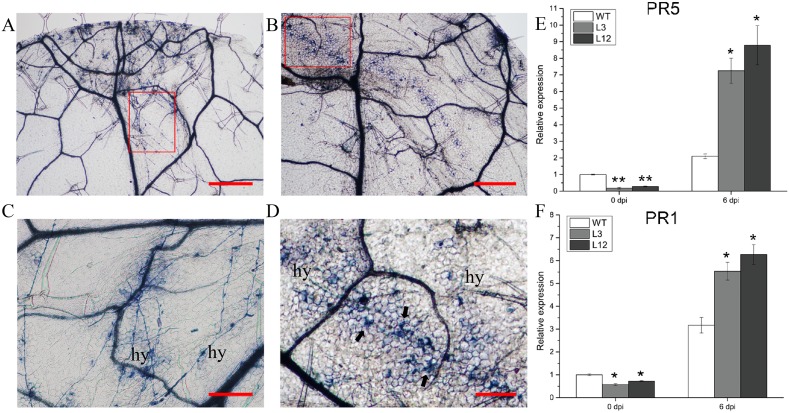
Fig 7. Inducing the hypersensitive response (HR) and pathogenesis-related genes in CkSNAP33 over-expressing Arabidopsis.
Trypan blue staining of leaf sections from WT (A) and transgenic plants (B) at 6 dpi with V. dahliae. Scale bar represents 500 μm. (C) Normal growth of V.dahliae hyphae (hy) across the leaf surface of WT. Close-up of the disease lesion regions from (A). Scale bar represents 200 μm. (D) V.dahliae induced programmed cell death (arrows) around the hyphae (hy). Close-up of the disease lesion regions from (B). Scale bar represents 200 μm. Real-time PCR analysis for the transcript levels of PR5 (E) and PR1 (F) in WT and transgenic lines before (0 dpi) and 6 days after inoculation with V. dahliae (6 dpi). Data are mean ± SE (n = 3), asterisks represent significant differences (*p < 0.05; **p < 0.01).

