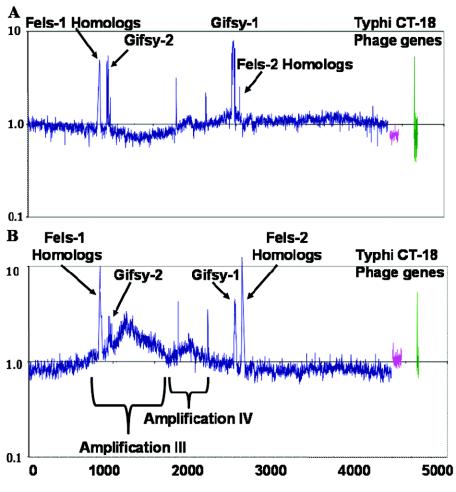
FIG. 3.
Serovar Typhimurium strains SL1344 and 14028s after treatment with 2 mM peroxide. The y axis indicates the ratio of DNA content 3 h after treatment to the DNA content of cells before treatment on a log10 scale. The x axis indicates the S. enterica serovar Typhimurium genes in order of position on the chromosome. (A) SL1344; (B) 14028s.

