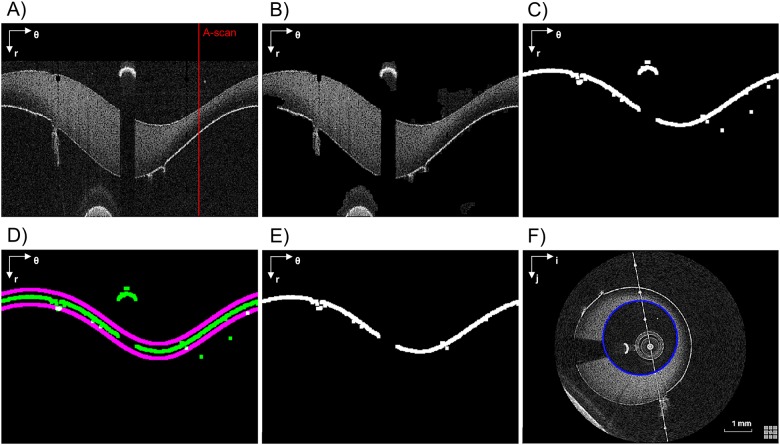
Fig 3.
Lumen contour detection steps. A) Pre-processed image (in polar coordinates). The red line highlights an example of A-scan. B) Image without background noise. C) Raw lumen contour detection. D) Detected lumen contour (green) and validity region of the segmentation (purple). E) Lumen contour without misdetections. F) Lumen contour (blue) detected after gaps closing, smoothing, and conversion back to Cartesian coordinates. The polar coordinate system (r; θ) or the Cartesian coordinate system (i; j) is indicated on the top left of each image.

