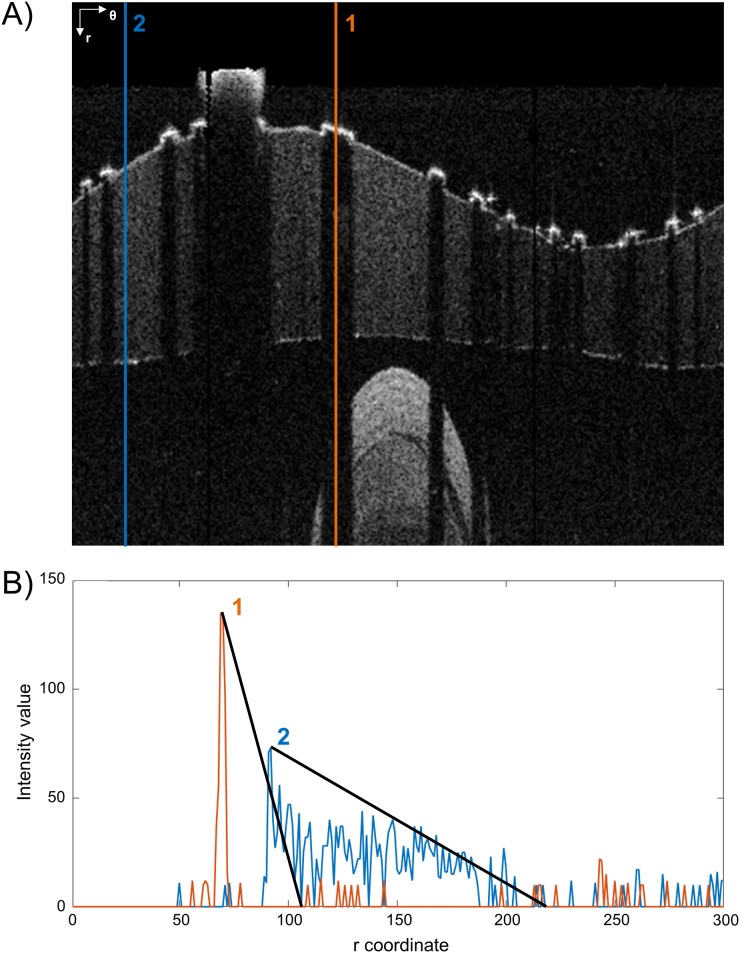
Fig 4.
Example of stent strut detection. A) Two A-scans are analyzed. The first one passes through a stent strut while the second one passes only through the vessel wall. The polar coordinate system (r; θ) is indicated on the top left. B) Corresponding intensity profiles of A-scans 1 and 2. The strut is detected because of the higher slope of the intensity profile of its A-scan.

