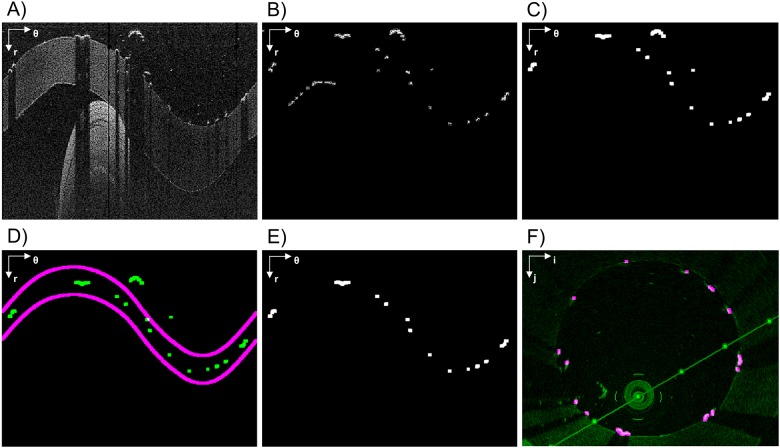
Fig 5.
Stent struts detection algorithm steps. A) Pre-processed image (in polar coordinates). B) Rough detection. C) Result of the application of the triangular shaped window followed by an intensity thresholding. D) Detected struts (green) and the validity region of the segmentation (purple). E) Image without errors. F) Detected struts (purple) overlapped to the original image (green) in Cartesian coordinates. The polar coordinate system (r; θ) or the Cartesian coordinate system (i; j) is indicated on the top left of each image.

