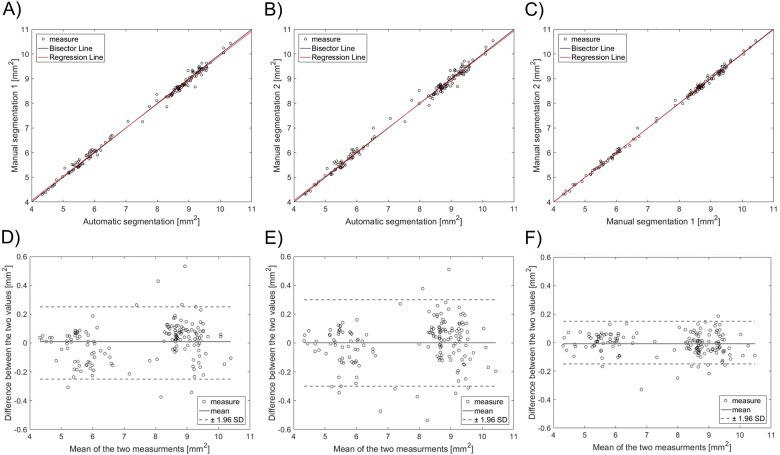
Fig 7.
Top—Linear regression plots of the lumen area of 160 randomly selected OCT images: A) automatic segmentation against manual segmentation by image reader 1 (R1); B) automatic segmentation against manual segmentation by image reader 2 (R2); C) manual segmentation by R1 against that by R2. Bottom—Bland-Altman plots of the lumen area: D) automatic segmentation against R1; E) automatic segmentation against R2; F) manual segmentation by R1 against R2.

