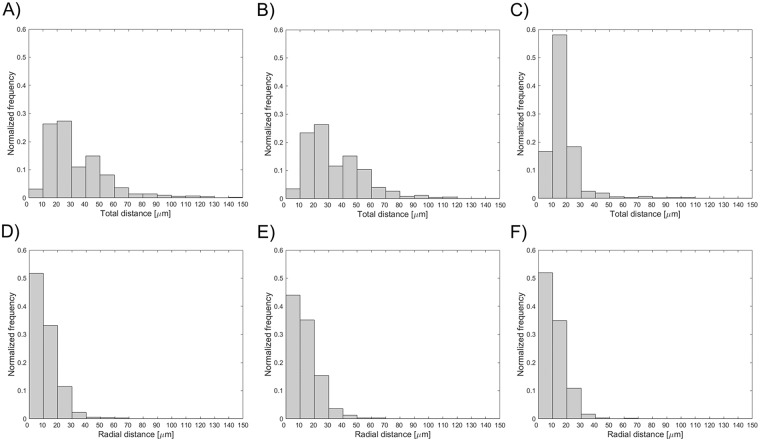
Fig 9.
Distributions of the total (top) and radial (bottom) distances between the centroid of each segmented strut (A, D) by the automatic algorithm and the nearest manually identified strut by image reader 1, (B, E) by the automatic algorithm and the nearest manually identified strut by image reader 2, and (C, F) by the two manual segmentations.

