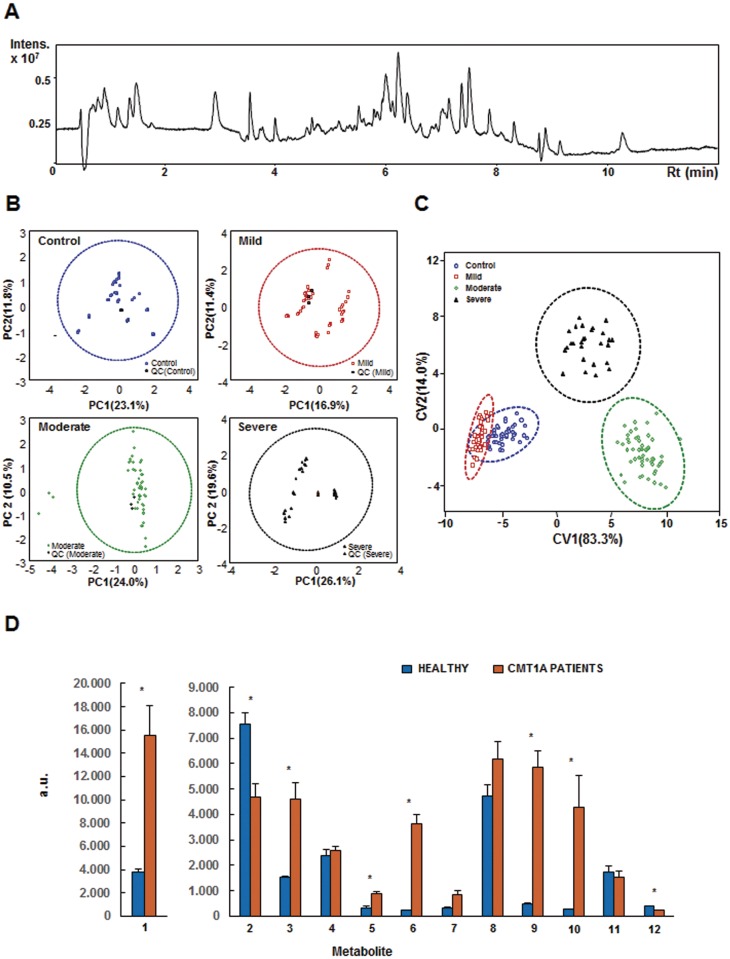
Fig 1. Analysis of plasma metabolome in CMT1A patients.
(A), Representative UHPLC-MS total ion chromatogram of plasma samples. (B), Plot in a two-dimensional Cartesian coordinate system, with the axes (principal components, PC) representing the greatest variations in the data of Control (blue), Mild (red), Moderate (green) and Severe (black) states related to CMT1A. Three quality control (QC) injections per group are also represented in the plot for the four groups of individuals. 95% confidence ellipses are also included. Triplicate outliers of one of the samples in the Moderate group fall out of the ellipse. (C), Plot of distribution of the plasma samples defined by the two canonical variables (CV1 and CV2) obtained by Canonical Variate Analysis considering the 12 selected metabolites after forward stepwise Linear Discriminant Analysis. The 95% canonical ellipses are also included. Control subjects and mild, moderate and severe CMT1A patients are represented by blue circles, red squares, green diamonds and black triangles, respectively. (D), Histogram showing the content of the 12 metabolites in plasma samples of healthy (blue, n = 15) and CMT1A patients (yellow, n = 42). The results shown are the mean values ± S.E.M. *, P<0.05 by Student’s t test.

