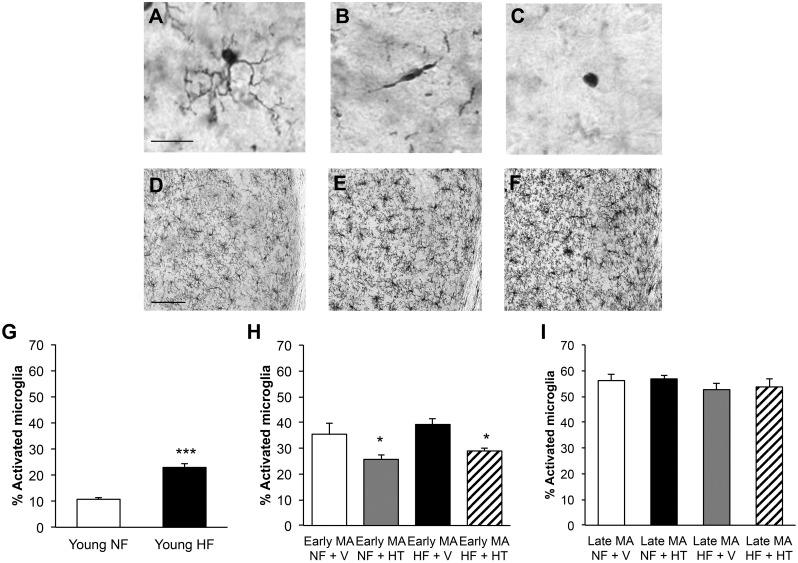
Fig 7. Effects of hormone therapy and high-fat diet on microglia in female mice.
Microglia were morphologically classified into three types: (A) Type 1 are highly ramified and were considered non-activated; (B) Type 2 have rod-shaped cell bodies and only short, mostly unbranched processes; (C) Type 3 have round cell bodies with no processes or only filopodia. The number of microglia in female 3xTg-AD mice visually increased with aging even without treatment: (D) young NF, (E) early middle-aged NF + V and (F) late middle-aged NF + V. (G) The percentage of activated microglia (types 2 and 3) increased with HF diet treatment in young females. HT was able to decrease the percentage of activated microglia in (H) early middle-aged but not (I) late middle-aged mice. In (G) white indicates Young NF (n = 6) and black indicates Young HF (n = 7). In (H), white bar indicates NF + V (n = 7), grey indicates NF + HT (n = 5), black indicates HF + V (n = 8), and striped indicates HF + HT (n = 6). In (I), white bar indicates NF + V (n = 6), grey indicates NF + HT (n = 4), black indicates HF + V (n = 6), and striped indicates HF + HT (n = 6). Data show mean ± SEM. Asterisks denote statistical significance: *** p<0.0001 relative to Young NF in (G), * = p<0.05 relative to NF+ V and HF + V, respectively in (H). Scale bar in (A) measure 20 μm and in (D) measures 100 μm.

