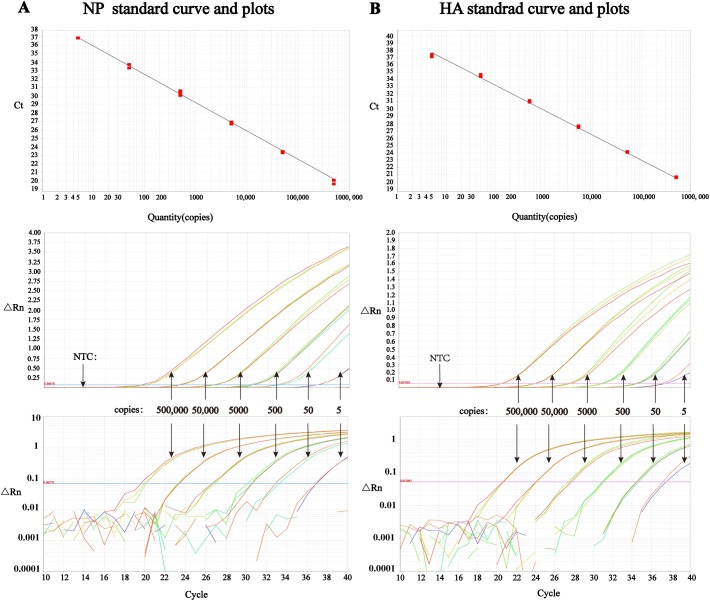
Fig 1. Amplification plots and standard curves drew by ABI 7500 software in multiplex detection with standard plasmids.
The threshold lines in amplification plots and linear curves in standard curves were draw automatically by ABI 7500 software. (A) NP standard curve between 5x100 and 5x10⁵ copies (y = -3.346x+39.272, R2 = 0.997, top), linear amplification plot (middle), and log amplification plot (bottom) in multiplex detection. (B) HA standard curve between 5x100 and 5x10⁵ copies (y = -3.43x+40.183, R2 = 0.998, top), linear amplification plot (middle), and log amplification plot (bottom) in multiplex detection.

