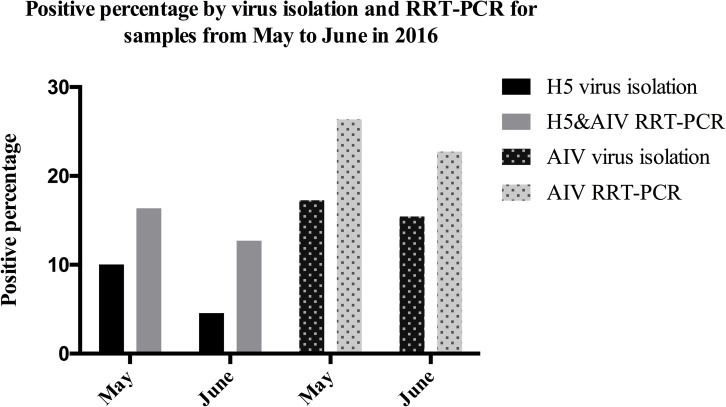
Fig 3. Positive percentage by virus isolation and RRT-PCR for live-poultry market samples from May 2016 to June 2016.
110 oral-pharyngeal or cloacal samples were collected from live poultry market in May and June respectively in 2016. Columns from left to right are 10%, 16.4%, 4.5%, 12.7%, 17.3%, 26.4%, 15.5%, 22.7%, which showed RRT-PCR method was of higher positive percentage than virus isolation.

