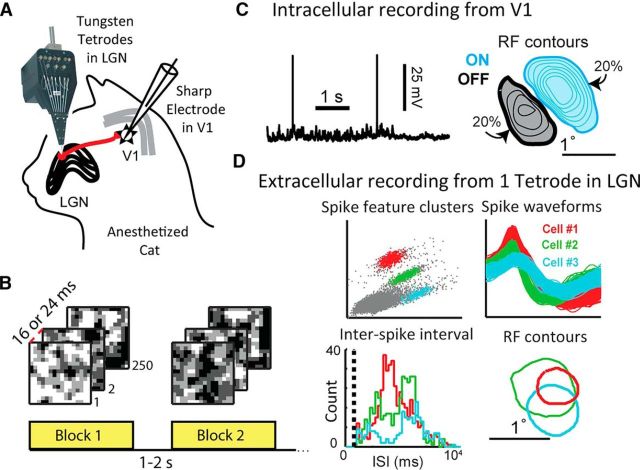
Figure 1.
Paired recordings of LGN and V1 in the anesthetized cat brain. A, An array of tungsten tetrodes was used to record the extracellular potentials of a population of LGN cells, and a sharp electrode was used to measure intracellularly from a single V1 cortical cell in L4/6. B, Blocks of the 2D white-noise used to map LGN-V1 RFs. C, Sample recording of Vm from a cortical V1 cell, along with the contours of the cell's RF, overlaid with the filled 20% contour. Light blue represents subregions of the RF that prefer bright contrasts (ON). Black represents dark-preferring (OFF) subregions. The ON subregion is stronger, and therefore is larger and has more contour lines (20%–80% of the strongest pixel found in RF, in steps of 10%). The weaker OFF subregion is smaller and only has 20%–50% contour lines. D, Sample extracellular recordings of three LGN cells on one tetrode. Top, Spike features used to cluster spikes into different cells, along with each cell's spike waveform. Bottom, Interspike interval histogram for each cell, where the dashed line indicates the refractory period of 1 ms. Contours of each LGN cell's RF center shown on the right.

