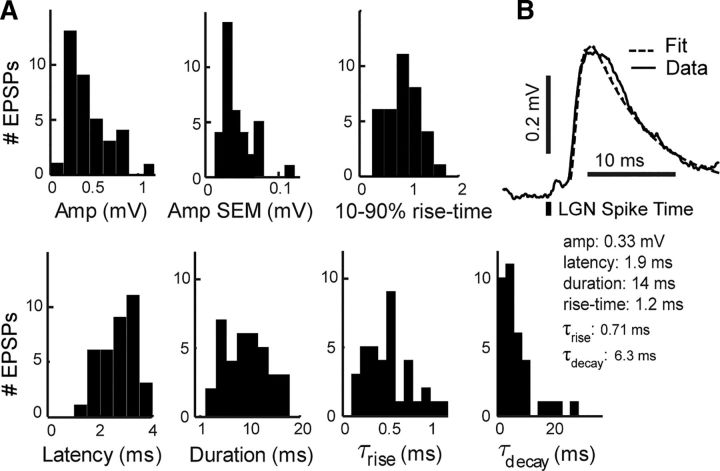
Figure 3.
Distribution of EPSP features. A, Features extracted from mean EPSPs. Duration, τrise, and τdecay were calculated based on fits of the EPSP to a function of two exponentials (see Materials and Methods). SEM of the amplitude was calculated using bootstrapped STAs (see Materials and Methods). B, A sample EPSP and its fit.

