Figure 1.
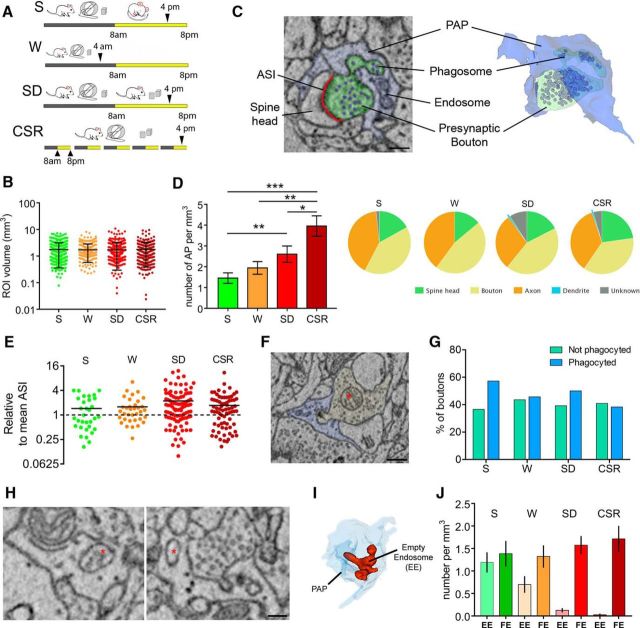
Sleep loss promotes AP. A, Experimental design. B, Volume of all ROIs analyzed in S (n = 295), W (n = 266), SD (n = 355), and CSR (n = 280) mice. Black bars depict mean and SD. C, Example of AP as visualized in two-dimensional SBEM images (left) and its 3D reconstruction (right). Scale bar: 200 nm. D, Left, Number of synaptic elements phagocyted by astrocytes in S, W, SD, and CSR mice. Values (mean ± SEM) are expressed per cubed millimeter of astrocytic volume. *p < 0.05; **p < 0.01; ***p < 0.001. Right, Breakdown frequency analysis of the neuropil structures involved in AP for S, W, SD, and CSR. E, ASI size of all S, W, SD, and CSR AP+ synapses relative to mean ASI size (dashed line) in a random sample of synapses (S, n = 302; W, n = 256; SD, n = 345; CSR, n = 296). F, Example of a presynaptic bouton (yellow) containing a mitochondrion (asterisk) and being phagocyted by a PAP (blue). Scale bar, 400 nm. G, Percentage of presynaptic boutons containing a mitochondrion that are (blue bars) or are not (green bars) involved in AP in S, W, SD, and CSR mice. H, Examples of FE (asterisk, left) and EE (asterisk, right). Scale bar, 130 nm. I, 3D reconstruction of one EE (red). Note its tubular structure within the PAP (light blue). J, Number of EE and FE (mean ± SEM) per cubed millimeter of astrocytic volume in S, W, SD, and CSR mice.

