Figure 4.
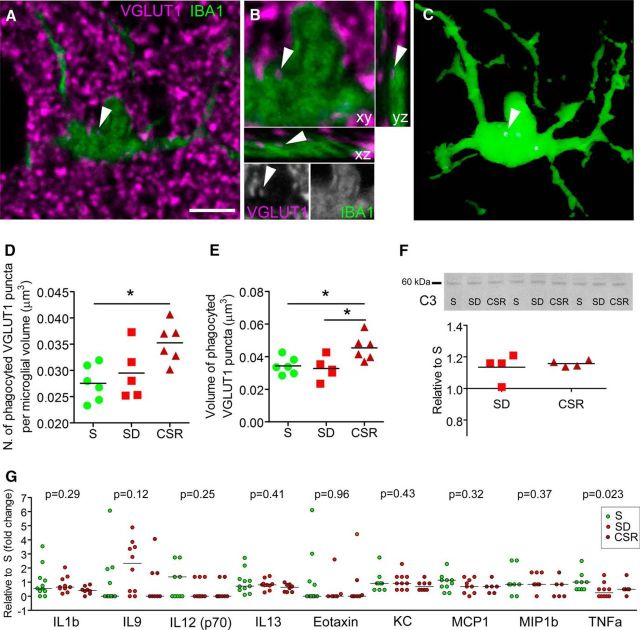
Chronic sleep loss is associated with microglial phagocytosis. A, Raw image showing an IBA-1-positive microglia (green) and VGLUT-1 puncta staining (magenta) in a representative CSR mouse. Scale bar, 5 μm. B, Enlarged frame of the cell shown in A, visualized also in the xz and yz projections and in gray separated channels, showing a VGLUT-1-positive element engulfed within the microglial soma (arrowheads). C, 3D reconstruction of the same cell showing the engulfed VGLUT-1 element (arrowhead). D, E, Number (D) and volume (E) of phagocyted VGLUT-1 elements per microglial cell for S (n = 6), SD (n = 5), and CSR (n = 6). *p < 0.05. F, Western blot analysis of the complement component C3 for SD and CSR pools relative to S pools. Representative bands are depicted above from cortical homogenates of S, SD, and CSR pools (n = 4 per pool). G, Protein levels of cytokines and chemokines in CSF from S (n = 11), SD (n = 10), and CSR (n = 8) mice. Protein levels were measured in individual CSF specimens using multiplex magnetic bead technology for the simultaneous measurement of the 23 cytokines/chemokines. Shown is the expression of the detected molecules and the relative p values obtained from the KW test.

