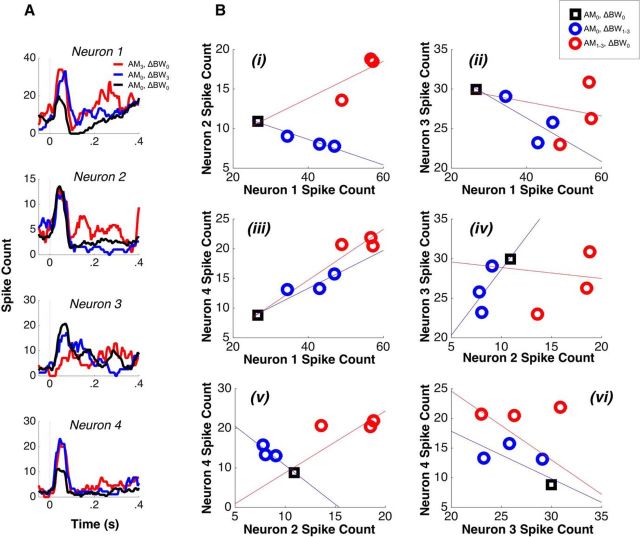
Figure 3.
Heterogeneous selectivity for AM and ΔBW leads to heterogeneous feature-specific tuning correlations. A, Peristimulus time histograms of four single neurons in response to three stimuli: (1) the largest value AM-only stimulus (red; AM3, ΔBW0), (2) the largest value ΔBW only stimulus (blue; AM0, ΔBW3), and (3) the unmodified sound (black; AM0, ΔBW0). We display only the largest value stimulus for each feature for clarity. Neuron 1 (top) exhibits an increased spike count for both AM and ΔBW; neuron 2 increases for AM, but decreases for ΔBW; neuron 3 decreases both AM and ΔBW; neuron 4 increases for both (similar to neuron 1). Whereas in A, we only used the largest AM and ΔBW values, in B, we show responses to all single-feature stimuli because these were the stimuli used to calculate feature-specific rtuning. In each panel is plotted the mean spike count for each of the three single feature sounds (red and blue circles), as well as the unmodified sound (black square). The lines correspond to weighted least-squares regression fits and illustrate the sign of rtuning (the upper and lower bounds of each fit's 95% confidence interval have the same sign). There is one panel for each of the six possible pairings of the four neurons in A. Pairs can have positive rtuning for both features (Biii; similar to Fig. 1D), negative rtuning for both features (Bii and Bvi; similar to Fig. 1E), or positive rtuning for one and negative rtuning for the other (Bi, Biv, and Bv; similar to Fig. 1C,F).

