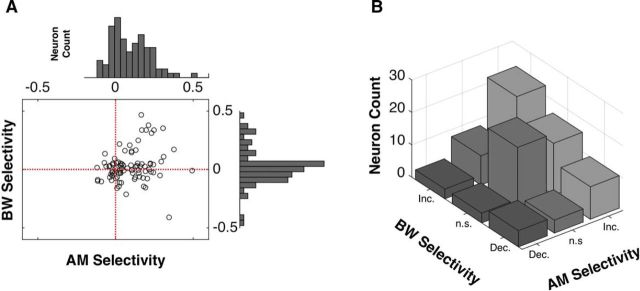
Figure 4.
Distributions of feature-specific single neuron tuning. In A, we plot each neuron's AM selectivity against each neuron's ΔBW selectivity and show the marginal distributions for single feature selectivity. For AM, the majority of neurons exhibit AM selectivity above 0 (i.e., primarily Increasing AM functions), whereas ΔBW selectivity is approximately equally distributed about 0 (i.e., ∼equal occurrence of increasing and decreasing ΔBW functions). We found no significant relationship between a neuron's AM selectivity and ΔBW selectivity, although across the population, there was a preponderance of neurons with increasing selectivity for both AM and ΔBW. B, We classify neurons' selectivity for each feature as increasing (Inc.), decreasing (Dec.), or nonselective (n.s.), for both AM and ΔBW. There is quite some heterogeneity in feature-specific single neuron selectivity, with approximately half of the neurons (45/92) exhibiting differential selectivity for the two features.

