Figure 6.

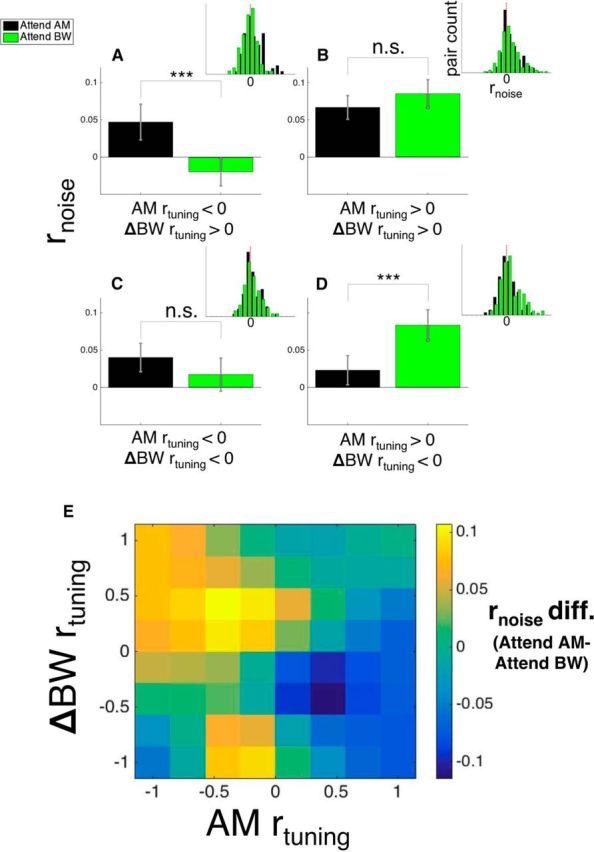
Attention-related effects on rnoise depend on both target and distractor rtuning. A, Average rnoise (bars represent means, whiskers represent ± SEM here and throughout the figure) between attention conditions for pairs with negative AM rtuning and positive ΔBW rtuning. Figure 1, C and F, would predict attention to enhance task performance by increasing rnoise between these pairs during AM attention (because this may concurrently enhance AM detection and suppress ΔBW detection) and decreasing rnoise during BW attention (because this may concurrently suppress AM detection and enhance ΔBW detection). We found that rnoise was significantly higher during AM attention (black) and lower during BW attention (green), consistent with our predictions (p < 0.05). For the pairs in B and C, AM rtuning and ΔBW rtuning are the same sign, either both positive (B) or both negative (C). We predicted that, for these pairs, shifts in rnoise will have the same effect on both target and distractor detection and therefore may provide no benefit to task performance. We found no effect of attention on rnoise in either group (p > 0.05). In D, these pairs are similar to those in A in that their AM and ΔBW rtuning have opposite signs. Our finding here is similar to what we observed in A: when the attended feature (AM) has positive rtuning, rnoise is lower than when the attended feature has negative rtuning (BW) (p < 0.05). In E, we used smaller rtuning bins to show how the effect of attention on rnoise depends on rtuning across the range of values. We calculated rnoise difference values (attend AM − attend BW), calculated the average rnoise difference within bins of width 0.33 for both AM and ΔBW rtuning, and then smoothed the binned averages. We observed increased rnoise difference values (rnoise higher during attend AM) in the upper left quadrant and decreased rnoise difference values (rnoise lower during attend AM) in the lower right quadrant, consistent with our findings using coarse categorization using rtuning sign. In A–D, inset histograms show the distribution of rnoise in each condition. All statistical analyses performed are described in the main text.
