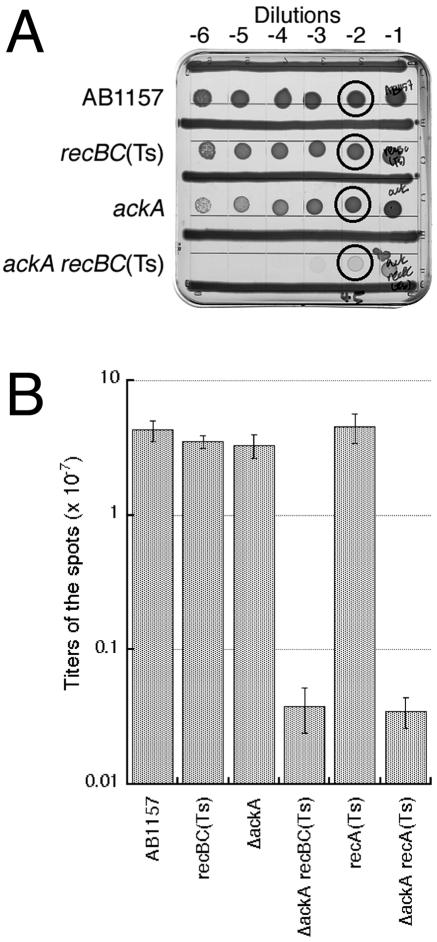
FIG. 7.
Quantification of ackA recBC(Ts) and ackA recA(Ts) inhibition relative to wild-type or single mutant strains. A. A representative plate to show the spots that were taken out for the analysis (circled). The strains are as follows: for recBC(Ts), SK129; for ackA, IYS4; for ackA recBC(Ts), IYS6. B. The titers of CFU. The data are averages of two to five independent determinations ± standard errors.

