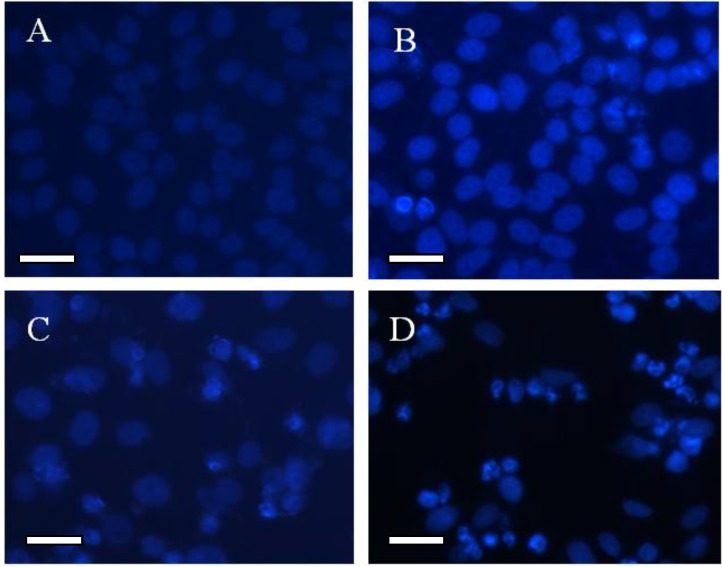
Figure 5.
The fluorescence microscopy images of HepG2 cells after DAPI dyeing. (A) HepG2 cells; (B) HepG2 cells treated with 0.5 µg/mL GA; (C) HepG2 cells treated with 5.0 µg/mL TiO2 nanofibers after UV irradiation; (D) HepG2 cells treated with GA-TiO2 nanocomposites after UV irradiation. Scale bar: 20 µm.

