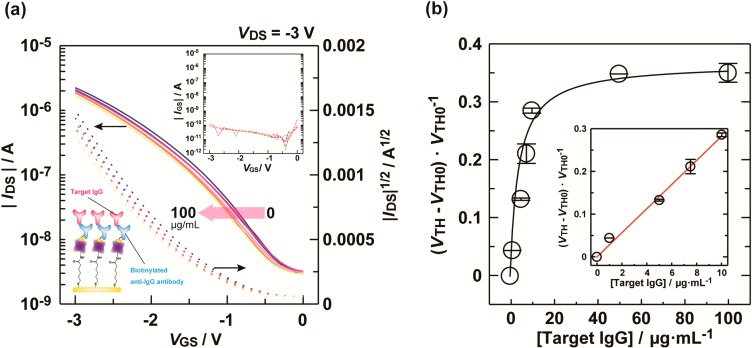
Figure 4.
(a) Transfer characteristics (IDS–VGS) of the OFET upon titration with target IgG in a D-PBS solution with 0.1 wt% BSA. [Target IgG] = 0–100 μg/mL. The inset shows the gate-source current (IGS–VGS); (b) Changes in threshold voltage (VTH) for the OFET by target IgG at various concentrations in a D-PBS solution with 0.1 wt% BSA. The inset shows the lower end of the titration.

