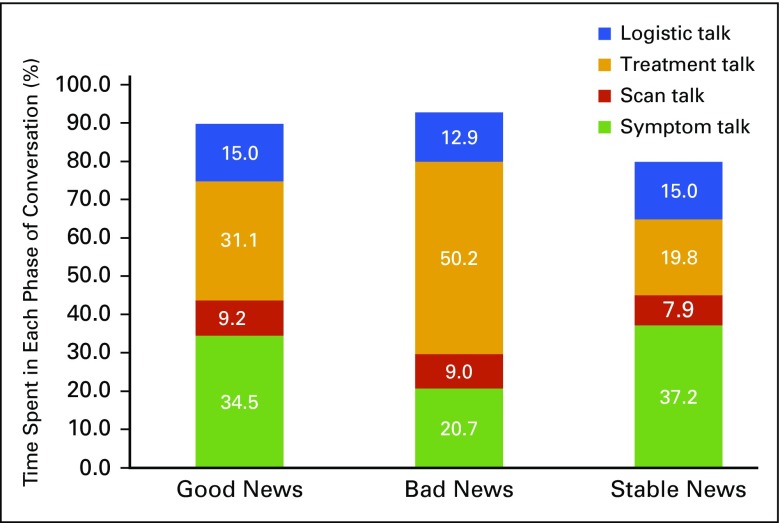
FIG 1.
Time management by type of news delivery. The graph shows the amount of time spent in each phase of conversation in relation to the type of news being delivered. The percentages do not add up to 100% because we excluded the small talk that often comes at the end of the clinic visit. Such small talk includes, for example, weekend plans.

