
Fig. 4.
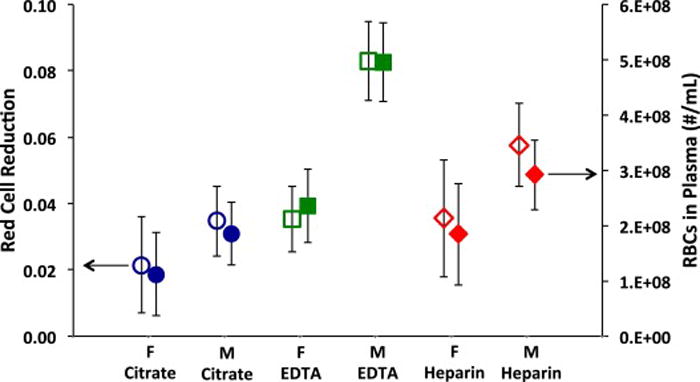
RBCs in recovered plasma versus the gender of the donor and the type of anticoagulant used. The left axis represents the red cell reduction (RCR) in the recovered plasma. The right axis represents the concentration of RBCs in the recovered plasma. The bacterial concentration ranged from 1.0 × 10³ to 1.7 × 10⁸ CFU/mL. The initial red cell concentrations in the slightly diluted blood had an average of 4.1 × 10⁹ RBCs/mL. M = male; F = female. The mean values and 95% confidence intervals are represented (n> 15).