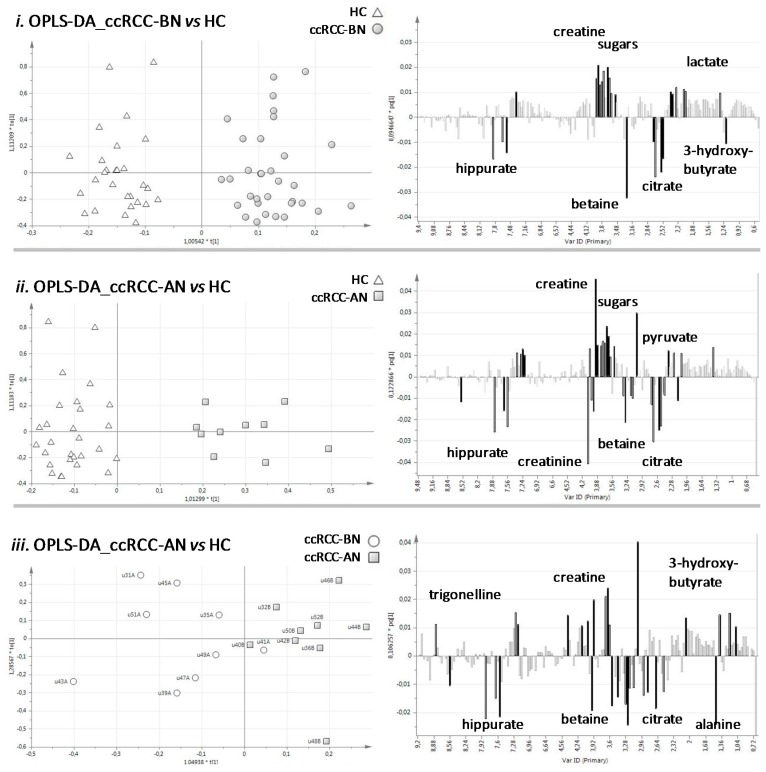
Figure 2.
Results of OPLS-DA applied on the three groups of urine samples, compared two-by-two. On the left there are the score plots, reporting the predictive component on X-axis (t1) and the first orthogonal component on Y-axis (to1); on the right there are the loading plots, reporting the variables (buckets of 0.04 ppm) on X-axis and the corresponding loading vector values of the predictive component (pq1 normalized to unit length) on Y-axis.


