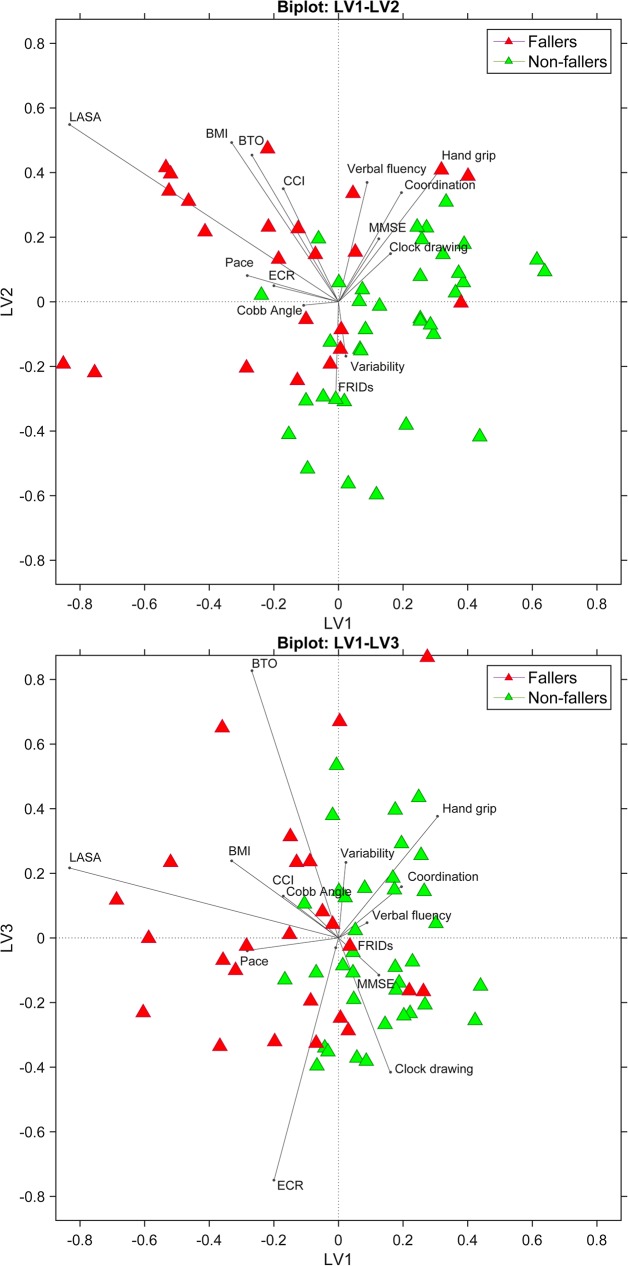
Fig 2. Biplots of latent variables (LV’s) 1 vs. 2 (upper trace) and LV’s 1 vs. 3 (lower trace) provide a graphical representation of the response variable (fall-status) and weights of the independent variables (patient characteristics, cognitive, and gait factors) with respect to the included LV’s.
As clearly shown, fallers and non-fallers (green and red respectively) are clustered. Weight vector size reflects the importance of the variable to the model. The direction of the vector refers to whether variables mainly relate to classification of fallers (sensitivity) or non-fallers (specificity). BMI = Body Mass Index; CCI = Charlson Comorbidity Index; LASA = Longitudinal Aging Study Amsterdam; FRIDs = Fall Risk Increasing Drugs; MMSE = Mini Mental State Examination; BTO = Benton Temporal Orientation; ECR = Enhanced Cued Recall.

