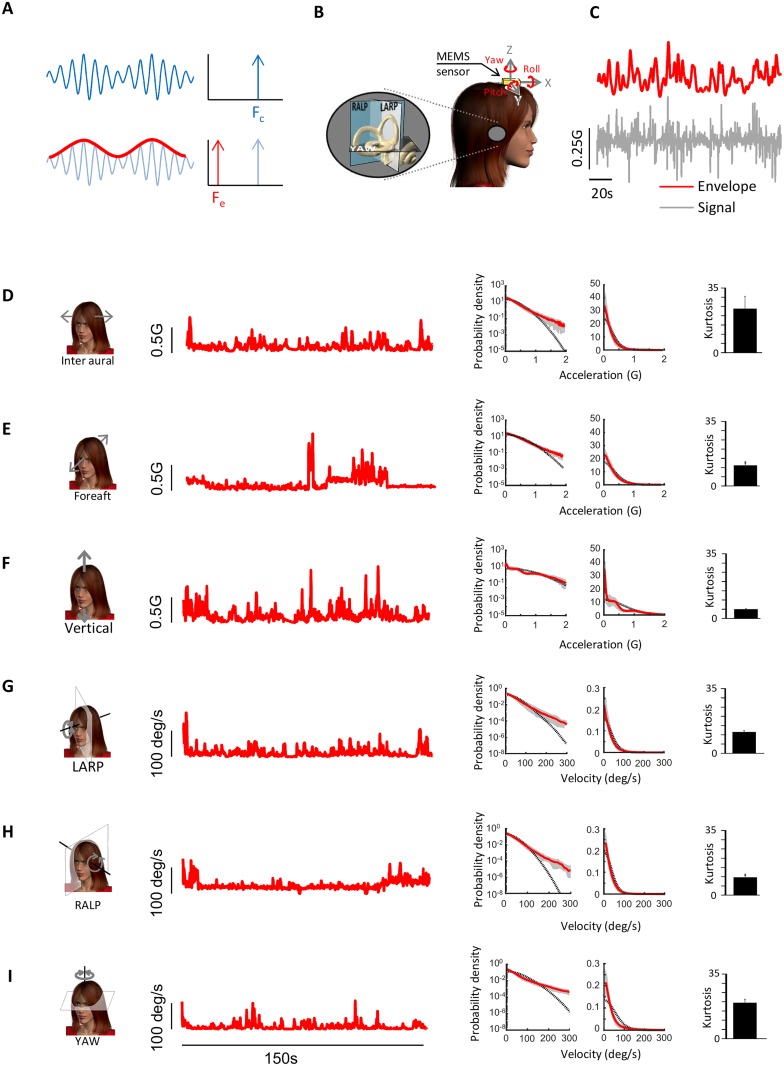
Fig 1. Envelope statistics of self-motion signals experienced during everyday activities.
A: Schematic showing a sinusoidal trace whose amplitude also varies sinusoidally (blue trace, top left). The power spectrum is non-zero only at the carrier frequency Fc (top right). The envelope of the signal (red trace, bottom left) oscillates with a different frequency Fe than that of the full signal as confirmed by taking its power spectrum (bottom right). B: A MEMS module consisting of three gyroscopes and three linear accelerometers was mounted on the subject’s head and measured linear accelerations along the Fore-Aft, Inter-Aural and Vertical axis as well as rotations about the Pitch, Yaw, and Roll axes. C: Example signal (gray) recorded from the MEMS module and its time varying envelope (red). D,E,F,G,H,I: Example angular velocity or linear acceleration envelope signals recorded during everyday activities for Inter-Aural (D), Fore-Aft (E), Vertical (F), LARP (G), RALP (H), and YAW (I). In each case, shown are an example time series (left), the probability distributions plotted using logarithmic (middle left) and linear (middle right) scales, together with a Gaussian fit (dashed black), and the population-averaged excess Kurtosis (right). Gray bands show 1 STD.

