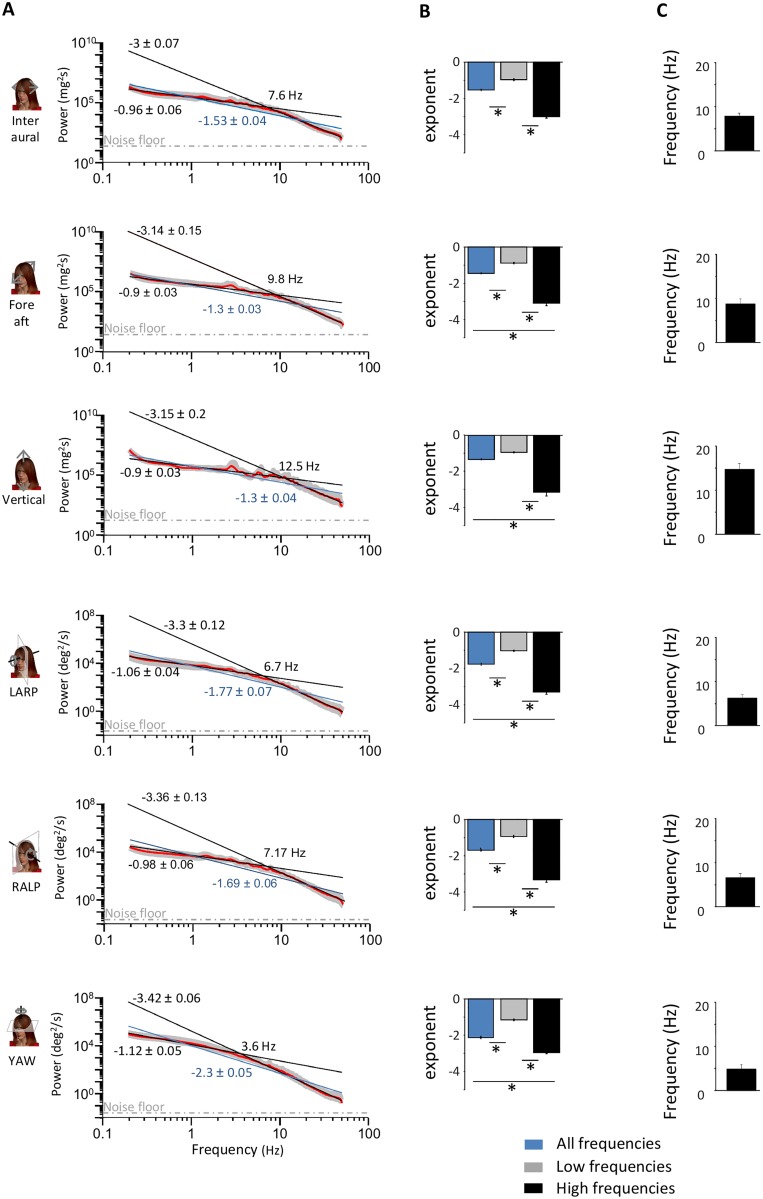
Fig 2. Envelope signals deviate from scale invariance.
A: Subject-averaged power spectra (red lines) with best-fit power laws over the low and high frequency ranges (black lines) as well as best-fit single power law over the entire frequency range (blue lines). Also shown are the best-fit power law exponents with confidence interval as well as the transition frequency. The dashed gray lines show the “noise floor”, which is the spectrum of the noise in the measurement obtained when the sensor was not moving (see Methods). Gray bands show 1 STD. B: Subject-averaged best-fit power law exponents over the low (gray) and high (black) frequency ranges for all six motion dimensions. Also shown for comparison are the subject-averaged best-fit power law exponents for a single power law over the entire frequency range (blue). “*” indicates statistical significance at the p = 0.01 level using a one-way ANOVA. C: Subject-averaged frequency at which the power spectrum starts decreasing more sharply for all six motion dimensions.

