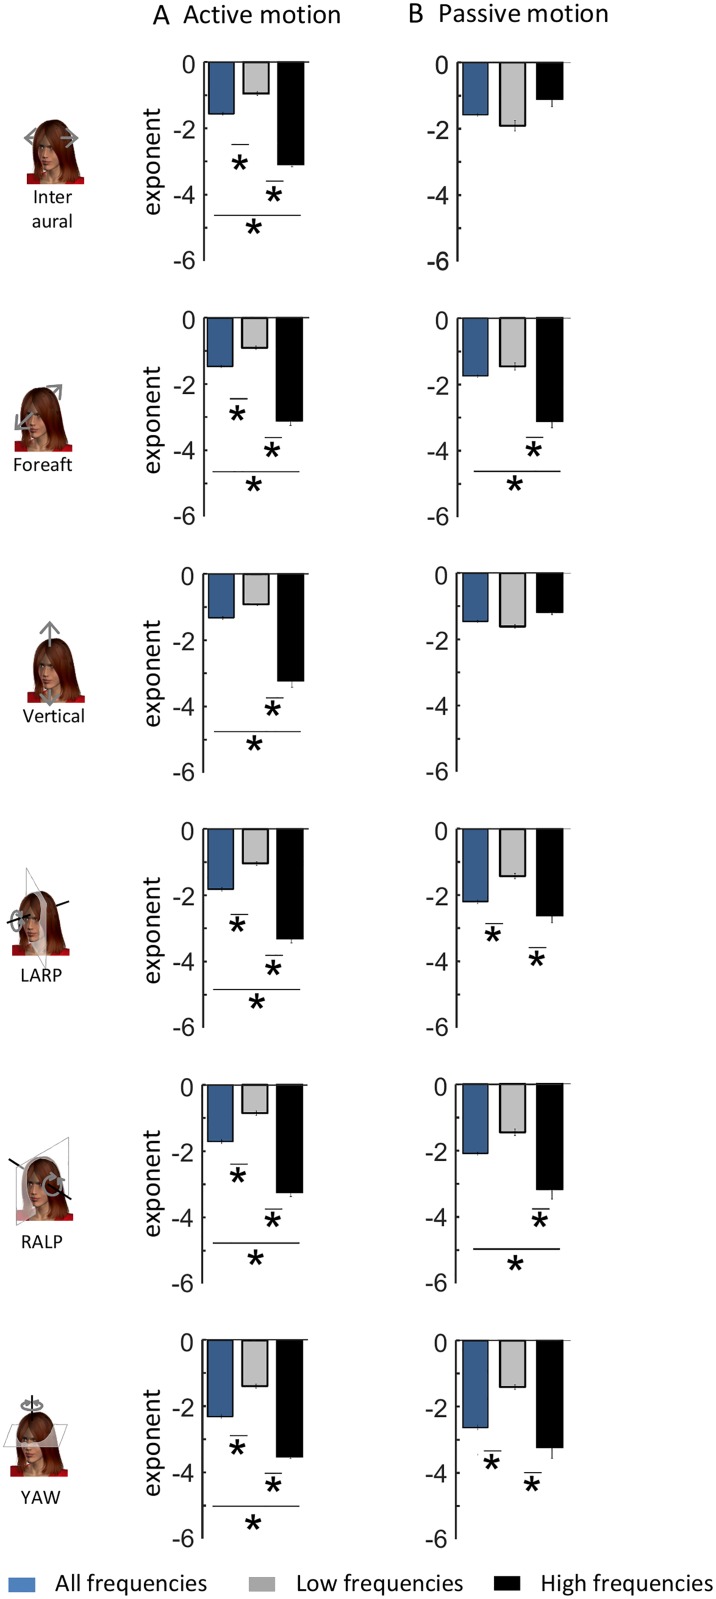
Fig 4. Comparison between the spectral properties of envelope signals recorded during active and passive self-motion.
A: Subject-averaged best-fit power law exponents over the low (gray) and high (black) frequency ranges for all six motion dimensions for active self-motion. Also shown for comparison are the subject-averaged best-fit power law exponents for a single power law over the entire frequency range (blue). B: Subject-averaged best-fit power law exponents over the low (gray) and high (black) frequency ranges for all six motion dimensions for passive self-motion. Also shown for comparison are the subject-averaged best-fit power law exponents for a single power law over the entire frequency range (blue). “*” indicates statistical significance at the p = 0.01 level using a one-way ANOVA.

