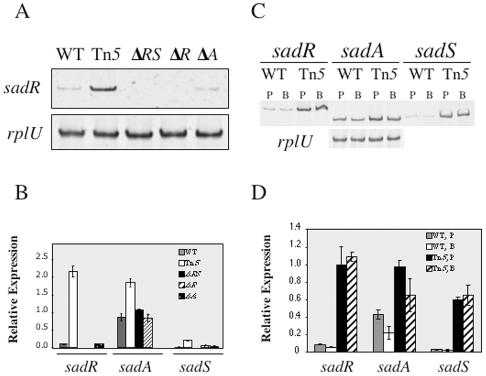
FIG. 4.
Expression of the sadARS locus. (A) Semiquantitative RT-PCR analysis of sadR expression in planktonically grown cells of WT strain PA14 and various isogenic sadARS mutants. (B) Relative expression levels of the sadR, sadA, and sadS genes in the WT and various sadARS mutants in planktonic cultures analyzed as for panel A. Expression levels are measured in fluorescence units (emitted at 537 nm), using Image Quant software and normalized to the rplU gene. (C) Semiquantitative RT-PCR analysis of sadR, sadA, and sadS gene expression in planktonic (P)- versus biofilm (B)-grown populations of the WT and the sad-160::Tn5 mutant. (D) Expression levels from panel C, measured in fluorescence units (as described above) and normalized to the rplU gene. Error bars indicate standard deviations.

