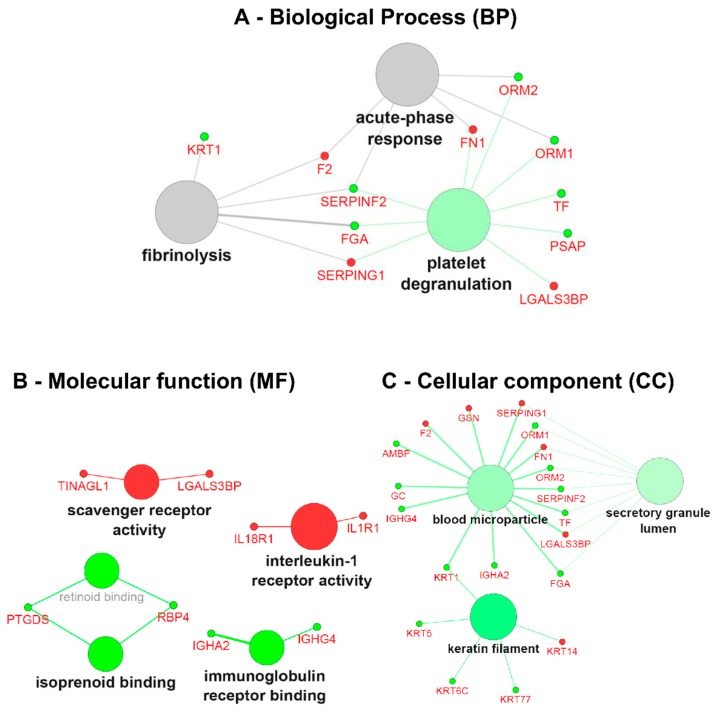
Figure 5.
Gene ontology (GO) term clustering (all data) of the ERT group: (A) Biological process (BP), (B)Molecular function (MF) and (C) Cellular component (CC). The increase of node size is associated with an increase of the statistical significance (Bonferroni-corrected p-value), the red node colour denotes an increased regulation of the term/group and green a decrease. Network nodes displayed in grey means that they share an equal number of genes/proteins associated with an up- and down-regulation.

