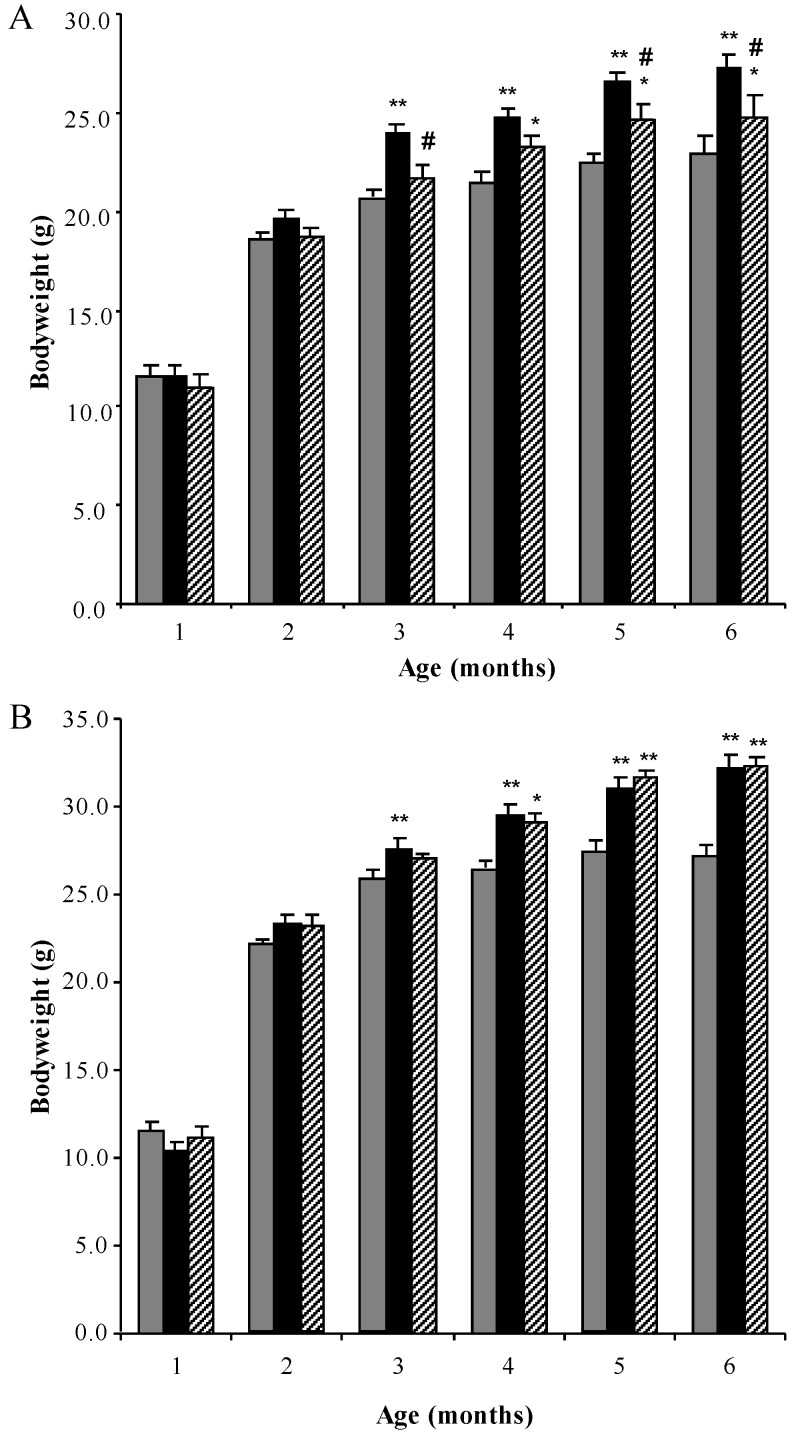
Figure 1.
Bodyweight analysis. Monthly bodyweights (grams) of normal (grey bars), MPS I untreated mice (black solid bars) and MPS I mice treated with rhodamine B (black hatched bars) in female (A) and male (B) mice respectively. Data is presented as the average + SEM for each group. * and ** indicates significantly different from normal (p < 0.05 and p < 0.001 respectively, two-way ANOVA, Tukey’s post-hoc test). # indicates MPS I treated significantly different from MPS I untreated (p < 0.05, two-way ANOVA, Tukey’s post-hoc test).

