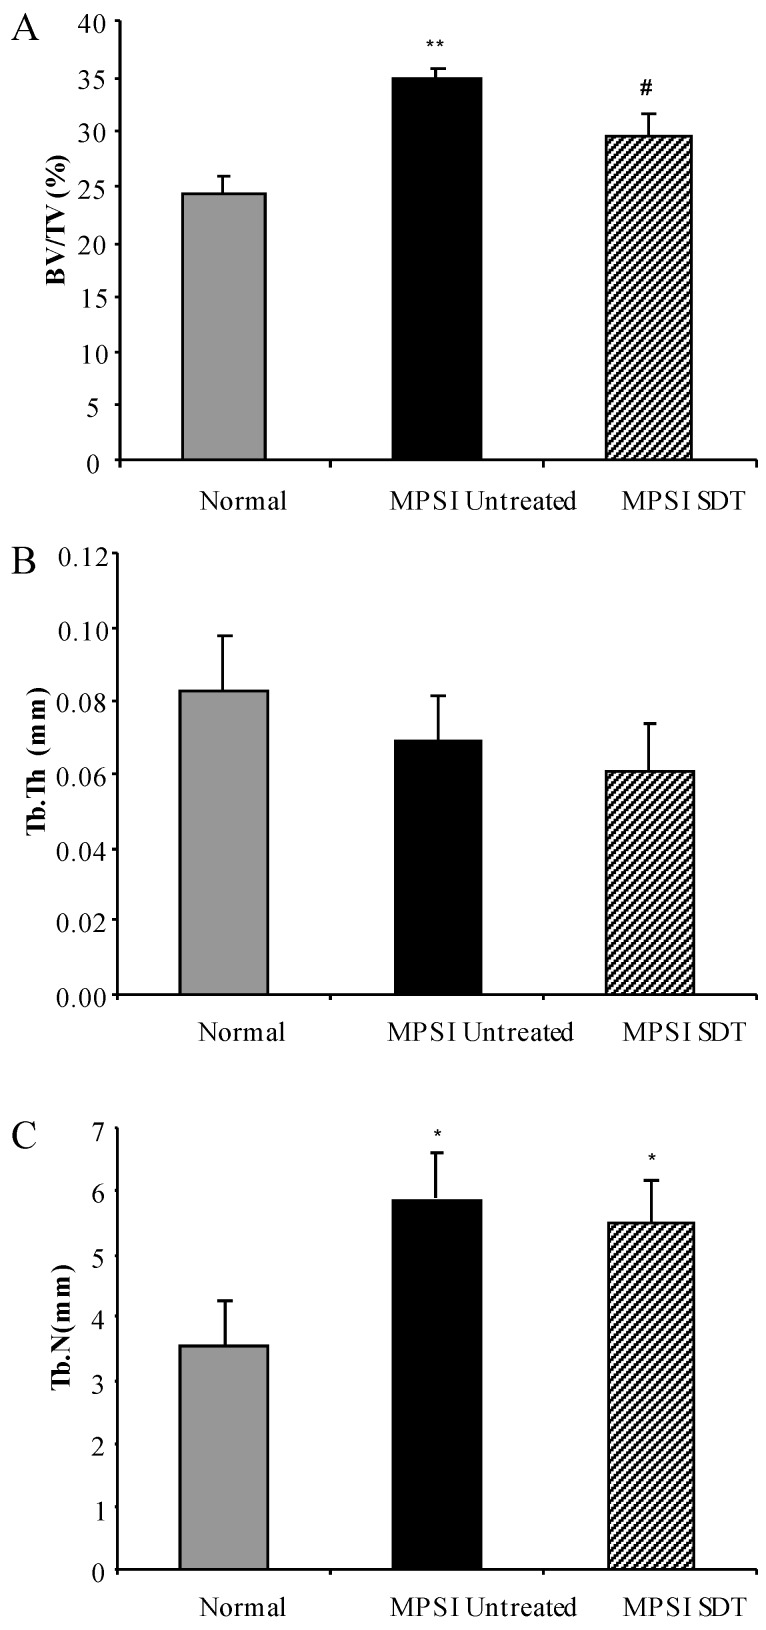
Figure 7.
Ex Vivo micro-CT of L5 vertebrae. Normal (grey bars), MPS I untreated mice (black solid bars) and MPS I mice treated with rhodamine B (black hatched bars) were analysed using ex vivo micro-CT at 6 months. 3D analysis of reconstructed slices yielded quantitative measurements of bone mineral volume (A), trabecular thickness (B) and trabecular number (C). Data is presented as average + SEM. * and ** indicate significantly different from normal (p < 0.05 and p < 0.001 respectively, one-way ANOVA, Tukey’s post-hoc test, # denotes MPS I treated significantly different from MPS I untreated (p < 0.05, one-way ANOVA, Tukey’s post hoc test).

