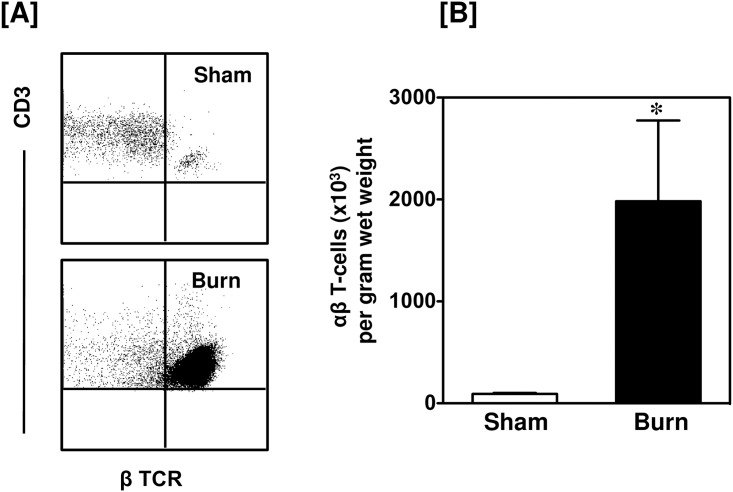
Fig 2. Total αβ T-cells.
After 24 h of sham or burn procedure, skin cells were studied for αβ T-cells using flow cytometry. [A] Representative dot plots of β TCR+ αβ T-cells from sham (upper panel) and burn mice (lower panel). The αβ T-cells are gated from the total T-cell population. [B] The number of αβ T-cells/g wet weight of the skin tissue from sham and burn mice. Data are mean ± SEM for 5–9 mice/group; *p < 0.05 vs. sham.

