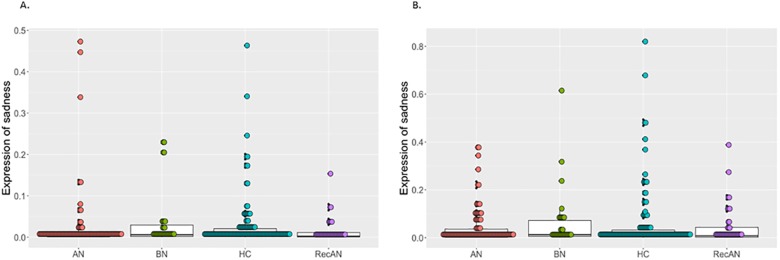
Fig 2. The intensity of expressions of sadness during Film 1 and Film 2.
A. The intensity of expressions of sadness during Film 1; B. The intensity of expressions of sadness during Film 2. The box plot represents summary statistic, highlighting the median and interquartile range with minimum and maximum. The grey dots represent each individual data point. AN = anorexia nervosa, BN = bulimia nervosa, RecAN = recovered from anorexia nervosa, HC = healthy comparison.

