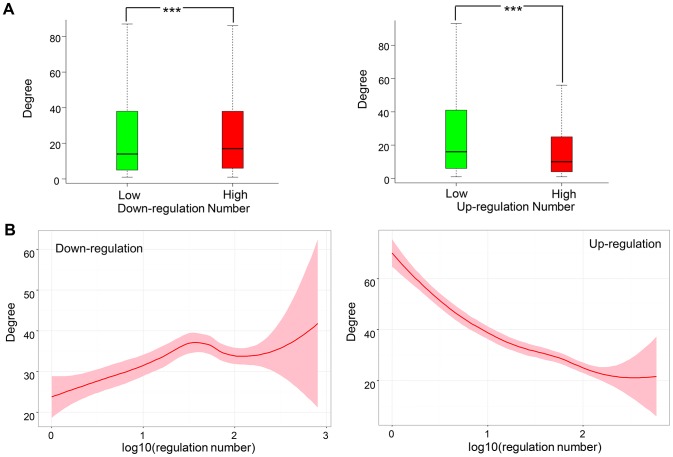
Fig 6. Interaction network degree analysis.
(A) Comparison of degree in PPI network of down_l versus down_h (left) and up_l versus up_h (right). (B) The correlation between degree and up/down-regulation number. The correlation curve is plotted by using the LOESS smoothing techniques and the shade indicates the confidence interval.

