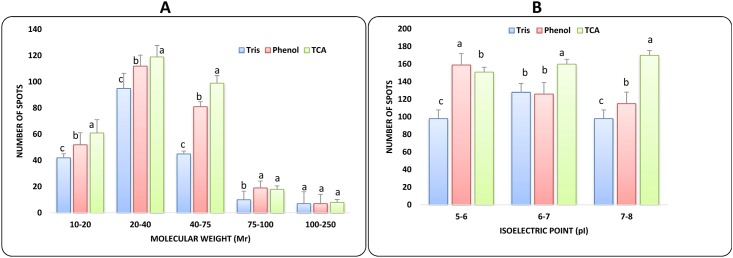
Fig 3. Differential spot distribution of proteins extracted by tris based, phenol based and TCA-acetone based method.
According to (A) molecular weight ranges (Mr) and (B) isoelectric point (pI). Bars with different letters within each range correspond to statistically significant differences (ANOVA, p<0.05).

