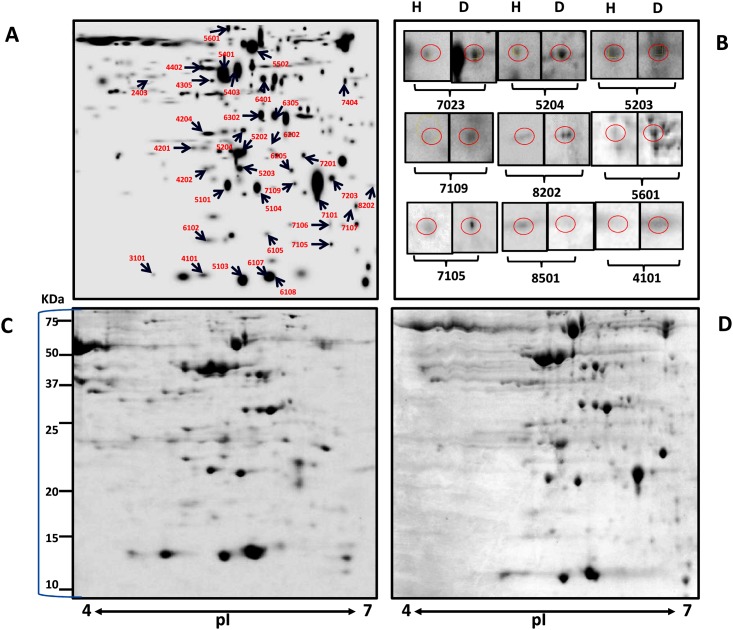
Fig 4. 2-DE analysis of differentially extracted proteins from W. somnifera in response to A. alternata infection.
(A) Master gel Image showing different protein spots selected for MALDI. (B) Changes in the expression pattern of proteins that were selected for quantitative gene expression analysis. The positions of differentially expressed proteins are indicated by circles. (C-D) Representative 2-DE protein profiles of healthy and diseased leaves samples. Proteins were separated over the pI range 4–7 in the first dimension and on 12% SDS-polyacrylamide gels in the second dimension. The gels were stained by colloidal Coomassie brilliant blue G-250. Spot volumes were normalized and determined using PDQuest software.

