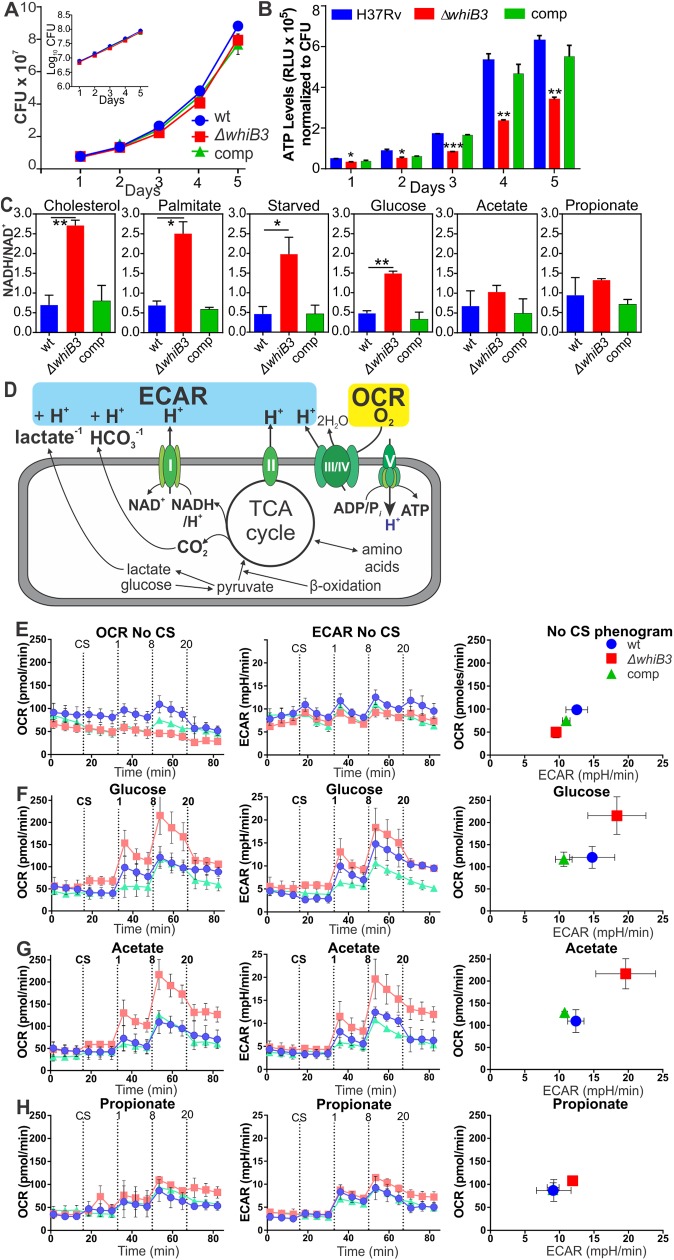
Fig 2. WhiB3 regulates ATP levels, NADH/NAD+ ratios and bioenergetic homeostasis in Mtb.
(A) Growth curves/rates for wt Mtb H37Rv, MtbΔwhiB3, and the complemented strain (comp) are matching as indicated by CFU over 5 days. Inset: growth rate in logarithmic format. (B) ATP levels in MtbΔwhiB3 were significantly lower than those in wt Mtb and the complemented strain on Day 5 as measured by luminescence (RLU) normalized to CFU. Error bars of (A) and (B) represent SEM of the mean of two independent experiments performed in duplicate. *p<0.01 (Unpaired Student’s t test). (C) NADH/NAD+ ratios of Mtb strains grown in 50 μM of the indicated carbon sources until an OD600 of 0.8. Error bars represent SD of the mean of at least three independent cultures, *p<0.05, **p<0.001 (Unpaired Student’s t test). (D) Schematic representation of Mtb extracellular flux measured by the XF96. (E-H) OCR, ECAR and a phenogram of wt Mtb (blue), MtbΔwhiB3 (red) and the complemented strain (green) after the addition of one of the following carbon sources (CS): (E) no carbon sources, (F) 50 μM glucose, (G) 50 μM acetate or (H) 50 μM propionate before and after addition of 1, 8 and 20 μM CCCP. Error bars represent SD from the mean of triplicate wells. Data are representative of three independent experiments.

