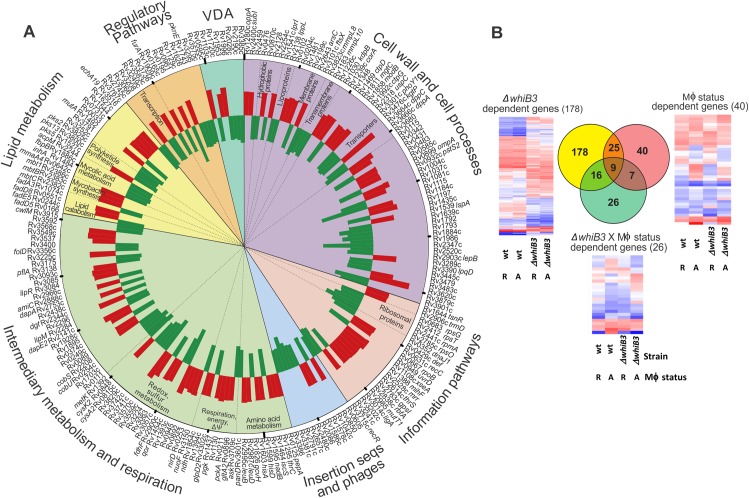
Fig 3. Role of WhiB3 in establishment of mycobacterial infection in macrophages.
(A) Circos plot of WhiB3-dependent responses in Mtb to macrophage infection, p<0.05 (>1.2x fold change). p values were calculated with the one-way ANOVA. Fold changes were calculated from the mean of four biological replicates. The array design compared transcript levels of intramacrophage bacilli (Mtb and MtbΔwhiB3) to strain-matched extracellular controls. Functional group categories are depicted by the colored segments and annotated on the outer rim of the plot. Sub-categorization is annotated on the inside of the plot. See S3 Table. (B) Impact of WhiB3 and macrophage activation on Mtb intracellular gene expression. Venn diagram showing overlap of genes whose expression is significantly altered due to strain (Yellow: wt Mtb or MtbΔwhiB3) or macrophage status (Red: resting versus activated) or both parameters (Green). Genes with significantly altered expression in response to at least one parameter (p<0.01) were identified by 2-way ANOVA. Only genes whose array signals passed quality filters in all three conditions were included. This illustrates the dominant impact of WhiB3 on the transcriptional adaptation of Mtb in macrophage phagosomes. Heat maps of the expression of the genes differentially regulated by the strain alone, macrophage status alone (R, resting; A, activated) or a combination of both parameters are depicted.

