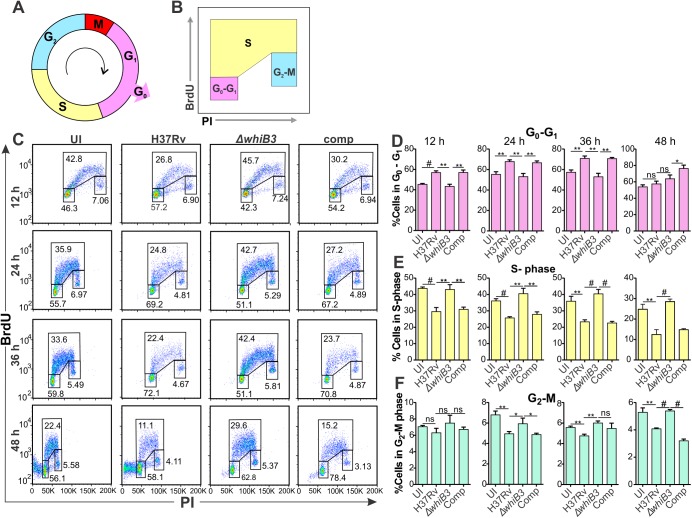
Fig 6. Mtb WhiB3 modulates the host cell cycle.
(A) Schematic diagram of the host cell cycle. (B) Schematic diagram of the dot plot of BrdU versus PI indicating the gating strategy. (C) Representative dot plots of BrdU and PI incorporation into RAW264.7 macrophages infected with wt Mtb H37Rv, MtbΔwhiB3 or the complemented strain at MOI 5 for the indicated time periods. (D-F) Percentage of RAW264.7 cells infected with wt Mtb, MtbΔwhiB3 or the complemented strain at MOI 5 for the indicated time points in the (D) G0-G1 phase, (E) S phase and (F) G2-M phases of the macrophage cell cycle. Error bars represent SD of the mean of triplicate experiments. Data are representative of two independent experiments. Unpaired Student’s t-Test was used to calculate the p value. #, p<0.0001; **, p≤0.001 and * p≤0.05.

