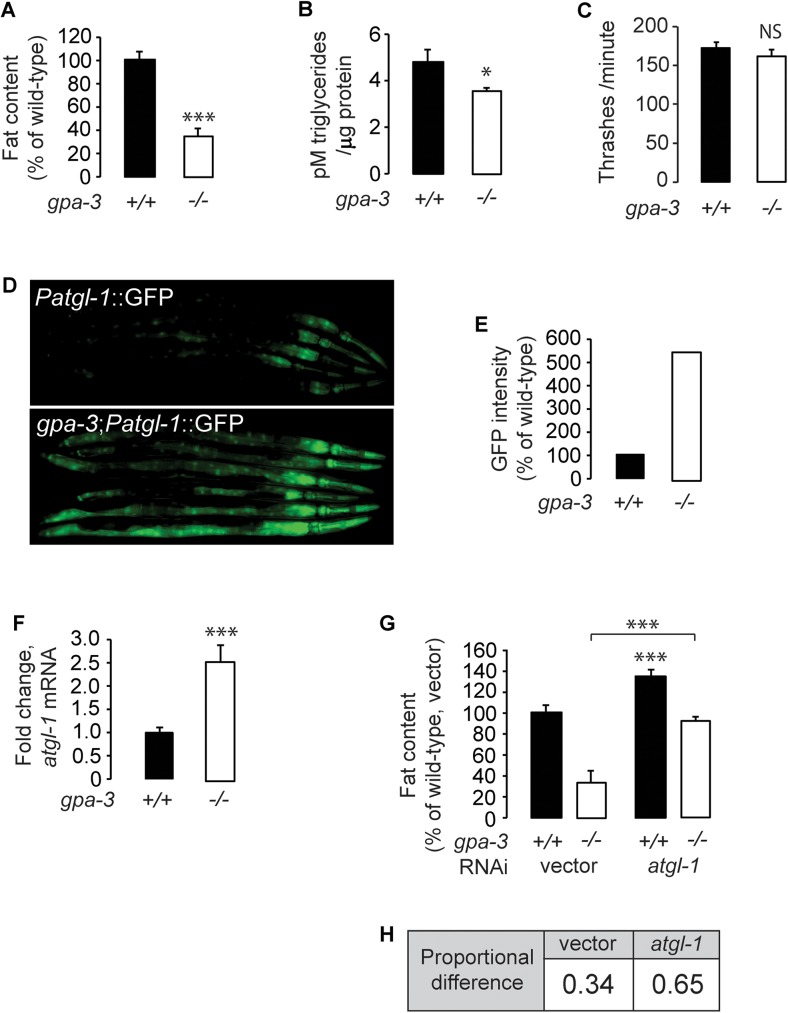
Fig 1. GPA-3 regulates body fat stores via regulating a conserved triglyceride lipase.
(A) Wild-type animals and gpa-3(pk35) mutants were fixed and stained with Oil Red O. Fat content was quantified for gpa-3 mutants and is expressed as a percentage of wild-type animals ± SEM (n = 20). ***, p<0.001 by Student’s t-test. See also S1A and S1B Fig. (B) Extracted lipids were quantified by liquid chromatography/mass spectrometry, data were normalized to protein, and quantified using the Pierce BCA Protein Assay kit. gpa-3 mutants have a significant reduction in triglycerides compared to wild-type animals. *, p<0.05 by Student’s t-test. (C) Thrashing rate was measured for wild-type animals and gpa-3 mutants. Young adults were individually introduced to M9 buffer and allowed to swim freely for 1 minute to become accustomed to the environment. The number of thrashes was then measured for the next 1 minute. gpa-3 mutants showed similar motor function to wild-type animals. Data is expressed as number of thrashes per minute ± SEM (n = 15). NS, not significant by Student’s t-test. (D) Representative images are shown of wild-type animals and gpa-3 mutants bearing an integrated atgl-1::GFP transgene. (E) The fluorescence intensity of atgl-1 expression was quantified for 6 randomly selected worms for each genotype and is expressed as a percentage of wild-type animals (F) atgl-1 mRNA levels were measured by quantitative PCR in gpa-3 mutants and is expressed as fold change relative to wild-type animals ± SEM (n = 3 biological replicates). ***, p<0.001 by Student’s t-test. (G) Wild-type animals and gpa-3 mutants were grown on vector or atgl-1 RNAi containing bacteria and then fixed and stained with Oil Red O. Fat content was quantified for each genotype and condition and is expressed as a percentage of wild-type animals grown on vector RNAi ± SEM (n = 20). Loss of atgl-1 in gpa-3 mutants led to a nearly 2-fold increase in fat content relative to wild-type. ***, p<0.001 by Student’s t-test. (H) Data from 1G showing proportional difference in fat content when ATGL-1 is inactivated in wild type animals and gpa-3 mutants. See also S1C Fig.

