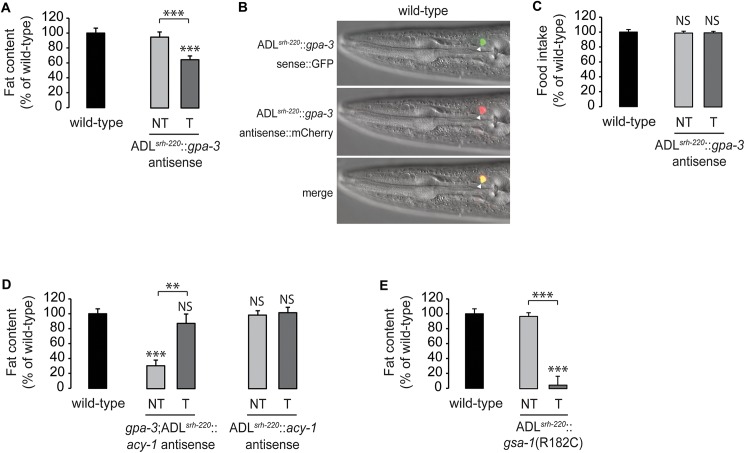
Fig 4. Enhanced cAMP production in ADL neurons decreases intestinal fat.
(A) Wild-type animals bearing antisense-mediated inactivation of gpa-3 expression in ADL neurons using the srh-220 promoter were fixed and stained with Oil Red O. Relative to non-transgenic controls (NT, light gray bar), transgenic animals (T, dark gray bar) bearing gpa-3 antisense in ADL neurons had a significant decrease in body fat. Data are expressed as a percentage of body fat in wild-type animals ± SEM (n = 20). ***, p<0.001 by one-way ANOVA. See also S4A Fig. (B) Representative images showing the expression of gpa-3 sense::GFP (upper panel), gpa-3 antisense::mCherry (central panel) and their co-localization in ADL (merged, lower panel). (C) Food intake in wild-type animals bearing antisense-mediated inactivation of gpa-3 expression in ADL neurons. Data are expressed as a percentage of wild-type animals ± SEM (n = 10). NS, not significant by one-way ANOVA. (D) Wild-type animals and gpa-3 mutants bearing antisense-mediated inactivation of acy-1 expression in ADL neurons using the srh-220 promoter were fixed and stained with Oil Red O. Relative to non-transgenic controls in the gpa-3 background (NT, light gray bar), transgenic animals (T, dark gray bar) bearing acy-1 antisense in ADL neurons restored body fat content to wild-type. In wild-type animals, there was no difference in fat content of non-transgenic (NT, light gray bar) and (T, dark gray bar) transgenic animals. Data are expressed as a percentage of body fat in wild-type animals ± SEM (n = 20). NS, not significant; **, p<0.01; ***, p<0.001 by one-way ANOVA. See also S4B Fig. (E) Wild-type animals bearing gsa-1(R182C), a dominant, gain-of-function mutation of C. elegans Gαs, in ADL neurons were fixed and stained with Oil Red O. Relative to non-transgenic controls (NT, light gray bar), transgenic animals (T, dark gray bar) bearing gsa-1(R182C) in ADL neurons had a significant decrease in body fat. Data are expressed as a percentage of body fat in wild-type animals ± SEM (n = 14–20). ***, p<0.001 by one-way ANOVA. See also S4C Fig.

