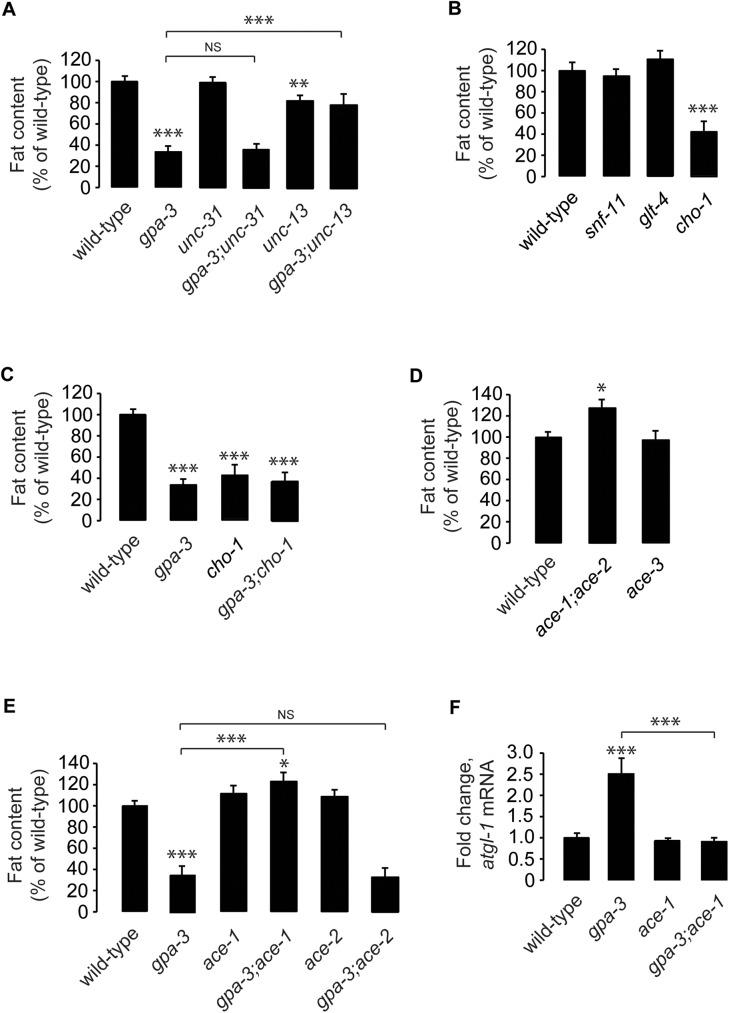
Fig 5. Cholinergic signaling drives GPA-3-mediated fat loss.
(A-E) Animals were fixed and stained with Oil Red O. Fat content was quantified for each genotype as indicated, and is expressed as a percentage of wild-type animals ± SEM (n = 14–20). NS, not significant; *, p<0.05; **, p<0.01; ***, p<0.001 by one-way ANOVA. See also S5A–S5E Fig. (F) atgl-1 mRNA levels were measured by quantitative PCR in gpa-3, ace-1 and gpa-3;ace-1 mutants and is expressed as fold change relative to wild-type animals ± SEM (n = 3 biological replicates). ***, p<0.001 by one-way ANOVA.

