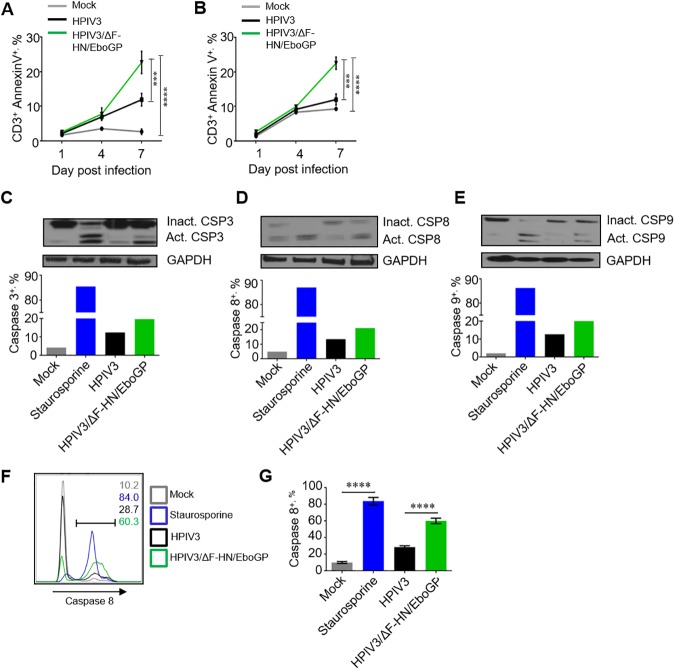
Fig 2. Cell death of T lymphocytes is triggered by direct binding of GP.
A. Percentages of annexin V+ CD3+ T cells in PBMCs incubated with HPIV3/ΔF-HN/EboGP or HPIV3 for 1, 4 and 7 days determined by flow cytometry. Mean values ±SE based on 3 donors. B. Percentages of annexin-V+ isolated primary CD3+ T cells incubated with HPIV3/ΔF-HN/EboGP or HPIV3 for 1, 4 or 7 days at 37°C determined by flow cytometry. Mean values ±SE based on 3 donors. A, B, Two-Way ANOVA followed by a Tukey’s multiple comparisons test, P values are indicated in Fig 1C, 1D and 1E. Activation of caspases in Jurkat cells incubated with HPIV3 or HPIV3/ΔF-HN/EboGP for 7 days or stimulated with staurosporine for 6 h determined by Western blotting: non-activated and activated caspases 3 (C), 8 (D) and 9 (E). Amounts of active caspases as percentages of total (active and inactive) caspases. Panels C, D and E are one set of representative data from two independent experiments. F, G. Flow cytometry analysis of activated caspase 8 in Jurkat cells incubated with HPIV3/ΔF-HN/EboGP or HPIV3 for 7 days or stimulated with staurosporine (control) for 6 h: representative primary data with percentages of positive populations indicated for each treatment (F) and mean percentages of caspase-8+ cells ±SE based on triplicate samples from one of three independent experiments. P values * P<0.05, ** P<0.01, *** P<0.001, **** P<0.0001 (Student T-test) (G).

