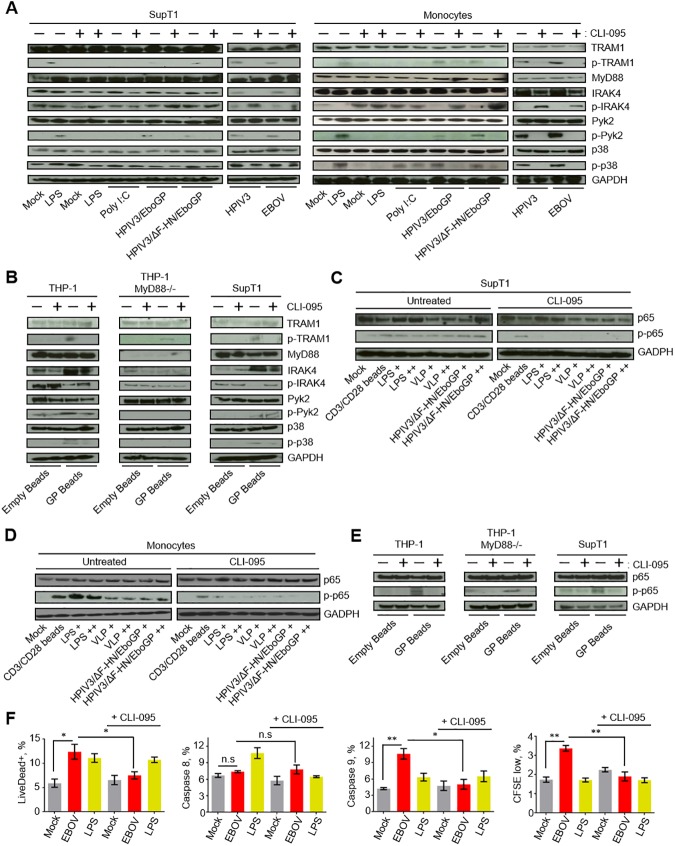
Fig 4. EBOV GP activates the TLR4 pathway that leads to T cell death.
A, B. Western blot analysis of proteins involved in TLR4 signaling pathway TRAM1, p-TRAM1, MyD88, IRAK4, p-IRAK4, Pyk2, p-Pyk2, p38, p-p38 in SupT1 cells and monocytes (A) or THP-1, THP-1 MyD88-/- and SupT1 cells (B) following stimulations with LPS, poly I:C, HPIV3/EboGP, HPIV3/ΔF-HN/EboGP, HPIV3 or EBOV (A) or empty beads or EBOV GP beads (B) in the presence or absence of the TLR4 inhibitor CLI-095. C, D, E. Western blot analysis of p65 phosphorylation in SupT1 cells (C), monocytes (D) or THP-1, THP-1 MyD88-/- and SupT1 cells (E) following stimulation with CD3/CD28 beads, LPS (+, 100 ng/ml, ++; 500 ng/ml), VLP (+, 100 μl; ++, 250 μl) and HPIV3/ΔF-HN/EboGP (+, MOI 0.1 PFU/cell; ++, MOI 1 PFU/cell), empty beads or EBOV GP beads, as indicated, with or without CLI-095. Western blots in panels A-E are representative of two independent experiments. F. Percentages of dead (Live/Dead+) cells, cell positive for caspase 8 and 9 and proliferated CD4+ T lymphocytes following a 4 day-long incubation with EBOV or LPS with or without CLI-095. Mean values ±SE based on triplicates from one of two independent experiments with P values * P<0.05, ** P<0.01, n.s., non-significant (Student T-test).

