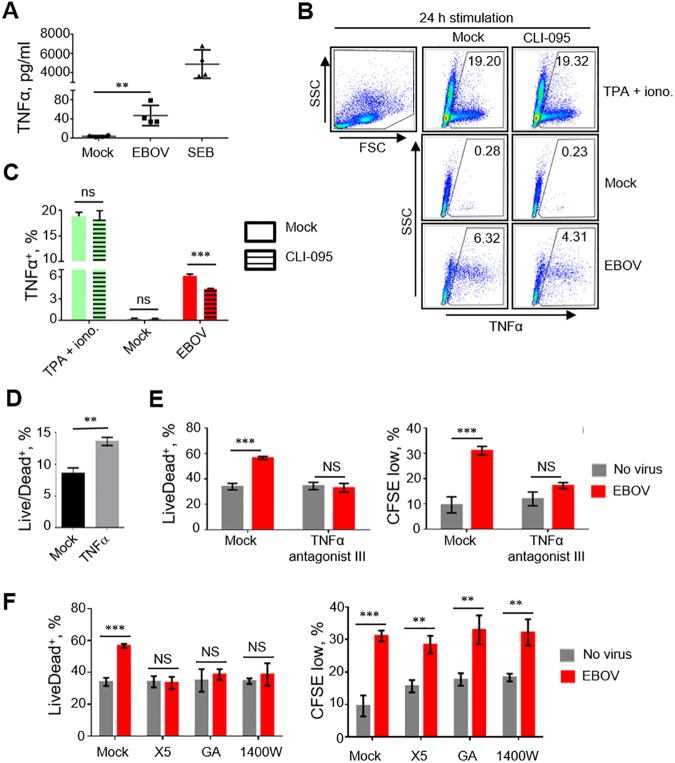
Fig 5. Mechanisms of cell death caused by EBOV.
A. Concentrations of TNFα in medium of purified CD4+ T cells cultured with EBOV or SEB for 4 days. Mean values ±SE based on 4 donors analyzed in duplicates. P values * P<0.05, ** P<0.01, *** P<0.001, **** P<0.0001 (Student T-test). B, C. Flow cytometry analysis of the percentages of TNFα+ SupT1 cells cultured with medium (mock), TPA/ionomycin or EBOV, mean values ±SE based on triplicate samples from one of two independent experiments shown (C). D. Percentages of Live/Dead+ SupT1 cells following daily additions of TNFα at 80 pg/ml for 4 days: mean values ±SE based triplicate samples from one of two independent experiments. E. Effects of TNFα antagonist III on CD4+ T cell death induced by EBOV at 4 days post infection: percentages of Live/Dead+ cells (left panel) and proliferated cells (right panel). Mean values ±SE based on triplicate samples from one of 3 independent experiments. F. Percentages of dead (Live/Dead+) cells (left panel) and proliferation (right panel) in the presence of necrosis inhibitors NecroX5 (X5), geldanamycin (GA) or N-(3-aminomethyl)benzylacetamindine (1400W) added immediately prior to the addition of EBOV at 4 days post infection. Mean values ±SE based on triplicate samples from one of 3 independent experiments. P values for panels E, F: ** P<0.01, *** P<0.001, n.s., non-significant (Student T-test).

